HOT TOPICS LIST
- MACD
- Fibonacci
- RSI
- Gann
- ADXR
- Stochastics
- Volume
- Triangles
- Futures
- Cycles
- Volatility
- ZIGZAG
- MESA
- Retracement
- Aroon
INDICATORS LIST
LIST OF TOPICS
PRINT THIS ARTICLE
by James Kupfer
A number of Fibonacci levels are nearby that may affect the price of gold.
Position: Hold
James Kupfer
Mr. Kupfer is a market professional and amateur stock market commentator. Disclosure: It is likely that Mr. Kupfer has or will enter a position in any security he writes about.
PRINT THIS ARTICLE
FAN LINES
A Short-Term View Of Gold
03/25/09 08:43:22 AMby James Kupfer
A number of Fibonacci levels are nearby that may affect the price of gold.
Position: Hold
| For the last two months I have been waiting for gold to reach what I feel will be a significant long- to intermediate-term top. That top likely occurred in February when gold peaked at $1,007 per ounce. While I do feel that it is very likely that was the top, it is always worth investigating alternative scenarios. With that thought in mind, there are a number of Fibonacci-based support and resistance levels worth watching for short-term trades. |
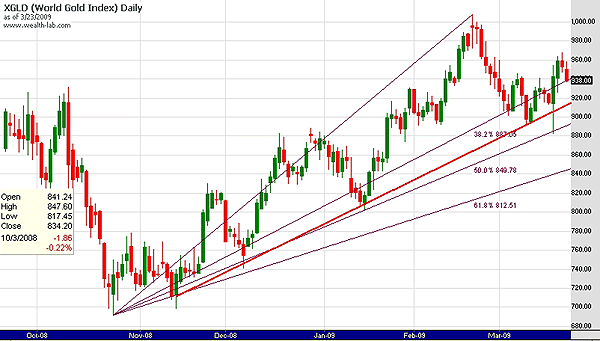
| Starting with the bullish case, there is a significant trendline (red) that can be drawn between multiple lows on gold since the October–November lows for gold. In addition, a Fibonacci fan drawn between the October low and recent high shows that there is good support for the current uptrend near the 50% retracement level (Figure 1). Prices bounced off the 50% level in both January and early in March. Taken together, these support lines lend credence to the idea that gold is in an established uptrend that is not yet over. |

|
| FIGURE 1: XGLD, DAILY. Here, gold appears to be in an uptrend. |
| Graphic provided by: Wealth-Lab. |
| |
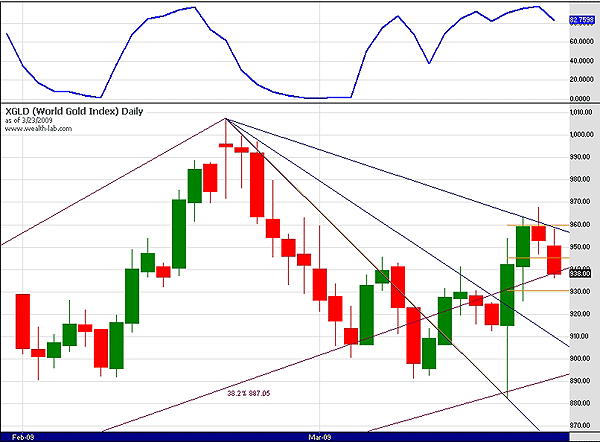
| Now to the short-term bearish case. Drawing both a Fibonacci retracement (orange lines) and speed resistance lines between the February top and the bottom a few days ago leads to some interesting observations. First, gold reached the 61.8% retracement level at $960, only to drop back down. At that same level, speed resistance lines show further resistance that gold failed to break above. Finally, daily stochastics have reached a very overbought level and have turned down, perhaps signaling the end of this current move. See Figure 2. |

|
| FIGURE 2: XGLD, DAILY. Has gold topped out? |
| Graphic provided by: Wealth-Lab. |
| |
| While gold is in an established uptrend that should be respected for now, these short-term warning signs signal a possible change in character for gold that traders should be prepared for. |
Mr. Kupfer is a market professional and amateur stock market commentator. Disclosure: It is likely that Mr. Kupfer has or will enter a position in any security he writes about.
Click here for more information about our publications!
Comments
Date: 03/26/09Rank: 4Comment:

Request Information From Our Sponsors
- StockCharts.com, Inc.
- Candle Patterns
- Candlestick Charting Explained
- Intermarket Technical Analysis
- John Murphy on Chart Analysis
- John Murphy's Chart Pattern Recognition
- John Murphy's Market Message
- MurphyExplainsMarketAnalysis-Intermarket Analysis
- MurphyExplainsMarketAnalysis-Visual Analysis
- StockCharts.com
- Technical Analysis of the Financial Markets
- The Visual Investor
- VectorVest, Inc.
- Executive Premier Workshop
- One-Day Options Course
- OptionsPro
- Retirement Income Workshop
- Sure-Fire Trading Systems (VectorVest, Inc.)
- Trading as a Business Workshop
- VectorVest 7 EOD
- VectorVest 7 RealTime/IntraDay
- VectorVest AutoTester
- VectorVest Educational Services
- VectorVest OnLine
- VectorVest Options Analyzer
- VectorVest ProGraphics v6.0
- VectorVest ProTrader 7
- VectorVest RealTime Derby Tool
- VectorVest Simulator
- VectorVest Variator
- VectorVest Watchdog
