HOT TOPICS LIST
- MACD
- Fibonacci
- RSI
- Gann
- ADXR
- Stochastics
- Volume
- Triangles
- Futures
- Cycles
- Volatility
- ZIGZAG
- MESA
- Retracement
- Aroon
INDICATORS LIST
LIST OF TOPICS
PRINT THIS ARTICLE
by Donald W. Pendergast, Jr.
Today's action in the broad US market indexes should leave little doubt that they've all embarked on a meaningful bear market rally.
Position: Accumulate
Donald W. Pendergast, Jr.
Donald W. Pendergast is a financial markets consultant who offers specialized services to stock brokers and high net worth individuals who seek a better bottom line for their portfolios.
PRINT THIS ARTICLE
TECHNICAL ANALYSIS
Broad US Markets On Track For Further Gains
03/24/09 01:01:33 PMby Donald W. Pendergast, Jr.
Today's action in the broad US market indexes should leave little doubt that they've all embarked on a meaningful bear market rally.
Position: Accumulate
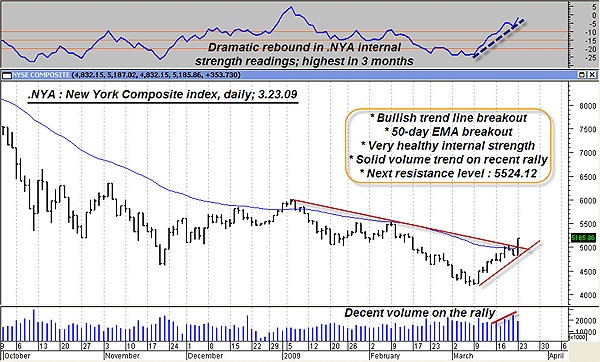
| Generally speaking, major bear markets (like the ones in 1973-74 and 2000-02) tend to bottom out and then reverse higher approximately six to 12 months before the economic/business cycle finally washes out and begins a major turnaround of its own. While no one really knows if this is the low in the stock market, and realizing that economic cycles can expand and/or contract without warning, this sudden bullish reversal by all of the major stock indexes is still a very hopeful development. A glance at the .NYA's daily chart should be enough to dispel any doubts that this current rally still has plenty of room to run. See Figure 1. |

|
| FIGURE 1: NYA, DAILY. All of the factors necessary to fuel a sustainable market rally appear to be present here; a trendline breakout, key moving average breakout, healthy volume, and rising internal strength readings. |
| Graphic provided by: MetaStock. |
| |
| The main ingredients necessary to fuel a continued, sustained market advance are all present here; the .NYA just blasted through a major downtrend line, closing above the 50-day exponential moving average (EMA) with a very wide range bar. The volume trend has also been very supportive of the rally from the lows, although today's volume wasn't as heavy as one might expect for such a major daily gain. Up at the top of the chart is the .NYA internal strength indicator, a unique tool that combines the rate of change, up/down volume, new highs/new lows, and advances/declines, using various weightings. The internal strength trend is very strong, moving in concert with prices. All in all, a very bullish chart, one that should help alleviate some of the worries of those who've seen their retirement accounts wither and die during the past 18 months or so. The next major resistance for the .NYA lies overhead near 5524.12, which is last month's high for this index, and there seems to be little standing in the way now to prevent that price level from being reached in relatively short order. See Figure 2. |

|
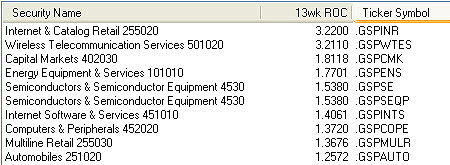
| FIGURE 2: TOP 10 S&P INDUSTRY GROUPS. These groups are ranked in order of the 13-week rate of change versus the New York Composite Index. |
| Graphic provided by: MetaStock. |
| |
| Now that we know that there is a good chance that the broad markets will continue to chug higher for a while, our next step is to identify which industry groups and exchange traded funds (ETFs) have the highest relative strength versus the .NYA. The first MetaStock exploration (in Figure 2) shows the top 10 S&P industry groups, ranked in order of each one's 13-week rate of change versus the .NYA. A wide range of industry groups populate the top 10 slots, bearing witness of the broad-based strength of the current market rally. The wireless telecom, energy, retail, semiconductor, computer software/hardware, capital market, and automobile industry groups are all represented. |

|
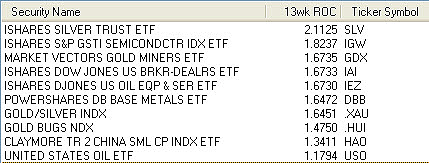
| FIGURE 3: TOP 10 ETFS. These top 10 exchange traded funds are ranked in order of 13-week rate of change versus the New York Composite Index. |
| Graphic provided by: MetaStock. |
| |
| To gain another view of which kinds of industry groups and/or commodities are outperforming an already strong stock market, here are the top 10 ETFs ranked in terms of 13-week rate of change versus the .NYA. Figure 3 contains plenty of commodity-linked ETFs, allowing us to also see how various commodity groups are doing compared to the stock market averages. Note how the perspective changes in this list, being heavily biased toward the commodity side of the trading world. Silver (SLV), crude oil (USO), base metals (DBB), gold mining (GDX) and energy services (IEZ), and the major gold/silver indexes (.HUI and .XAU) take up seven of the top 10 slots, lending credence to the belief that the commodity sector may be preparing to launch into yet another substantial bull run. |
| Hard to believe, isn't it? Less than three weeks ago, the Dow Jones Industrial Average (DJIA), the NASDAQ 100, and Standard & Poor's 500 appeared to be standing at the edge of the abyss, with little in the way of technical support to restrain another vicious round of selling. If you examine much of the extreme doom and gloom commentary (from the usual permabears, of course) in the weeks leading up to the dramatic turnaround this month, you might have found it to be a wonderful contrarian indicator, one that might have helped prepare you for the violently bullish round of capitulation that we just witnessed. Now, our job as traders and investors is to be aware of excessively bullish market sentiment in the weeks and months ahead, because that could be a valuable tipoff that this bear market bull has finally worn out its welcome. |
Donald W. Pendergast is a financial markets consultant who offers specialized services to stock brokers and high net worth individuals who seek a better bottom line for their portfolios.
| Title: | Writer, market consultant |
| Company: | Linear Trading Systems LLC |
| Jacksonville, FL 32217 | |
| Phone # for sales: | 904-239-9564 |
| E-mail address: | lineartradingsys@gmail.com |
Traders' Resource Links | |
| Linear Trading Systems LLC has not added any product or service information to TRADERS' RESOURCE. | |
Click here for more information about our publications!
Comments
Date: 03/24/09Rank: 5Comment:

Request Information From Our Sponsors
- StockCharts.com, Inc.
- Candle Patterns
- Candlestick Charting Explained
- Intermarket Technical Analysis
- John Murphy on Chart Analysis
- John Murphy's Chart Pattern Recognition
- John Murphy's Market Message
- MurphyExplainsMarketAnalysis-Intermarket Analysis
- MurphyExplainsMarketAnalysis-Visual Analysis
- StockCharts.com
- Technical Analysis of the Financial Markets
- The Visual Investor
- VectorVest, Inc.
- Executive Premier Workshop
- One-Day Options Course
- OptionsPro
- Retirement Income Workshop
- Sure-Fire Trading Systems (VectorVest, Inc.)
- Trading as a Business Workshop
- VectorVest 7 EOD
- VectorVest 7 RealTime/IntraDay
- VectorVest AutoTester
- VectorVest Educational Services
- VectorVest OnLine
- VectorVest Options Analyzer
- VectorVest ProGraphics v6.0
- VectorVest ProTrader 7
- VectorVest RealTime Derby Tool
- VectorVest Simulator
- VectorVest Variator
- VectorVest Watchdog
