HOT TOPICS LIST
- MACD
- Fibonacci
- RSI
- Gann
- ADXR
- Stochastics
- Volume
- Triangles
- Futures
- Cycles
- Volatility
- ZIGZAG
- MESA
- Retracement
- Aroon
INDICATORS LIST
LIST OF TOPICS
PRINT THIS ARTICLE
by Chaitali Mohile
After hitting a 52-week high, Cypress Semiconductor marched toward a crucial resistance level. An ascending channel that formed during an upward rally shows new trading strategies.
Position: Sell
Chaitali Mohile
Active trader in the Indian stock markets since 2003 and a full-time writer. Trading is largely based upon technical analysis.
PRINT THIS ARTICLE
CHANNEL LINES
Cypress Semiconductor At Crucial Levels
03/24/09 11:55:49 AMby Chaitali Mohile
After hitting a 52-week high, Cypress Semiconductor marched toward a crucial resistance level. An ascending channel that formed during an upward rally shows new trading strategies.
Position: Sell
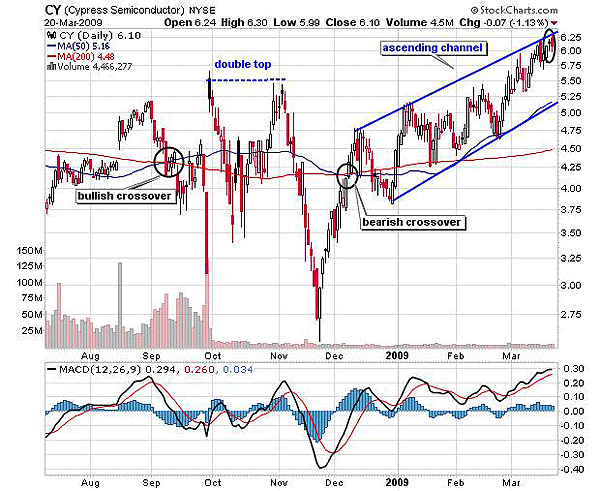
| Cypress Semiconductor (CY) witnessed rough trading sessions from August to November 2008. The bears and the bulls played tug-of-war during the rallies, and as a result, CY failed to move in one single direction. The 200-day and the 50-day moving average (MA) in Figure 1 was a critical support as well resistance for the stock. In a time span of four months, the MAs went through a bullish crossover in September and a bearish crossover in December. This indicated a weaker strength and high volatility in price momentum. The moving average convergence/divergence (MACD) (12,26,9) was zigzagging in positive and negative territory. The MACD line fluctuated near the trigger line of the indicator, suggesting uncertainty to carry the rally in one direction. This volatility continued till a short-term double-top was formed (see Figure 1). |

|
| FIGURE 1: CY, DAILY. The stock has reached an upper trendline resistance of the channel. |
| Graphic provided by: StockCharts.com. |
| |
| The double top is a bearish reversal formation that drags the stock to new lows. Since CY formed the second peak immediately after the four weeks or one month (in November), the pattern is considered to be short-term. In Figure 1, we can see that CY plunged to a new low at $2.75. This bearish rally was the first successful directional movement after the long volatile period. Thus, the impact of the pattern was strong. |
| However, the pullback rally from the new low was equally strong and steady. A deep valley formed by the MACD (12,26,9) indicated fast recovery. As soon as the 200-day MA and the 50-day MA resistances were converted to the support, CY formed higher highs and higher lows. If we draw two trendlines, one joining higher tops and another joining the higher bottoms, we get an ascending channel (see Figure 1). |
| Trading within the two trendlines of the channel would be a good strategy in current market conditions. Traders can enter a long position at the lower trendline and book profits or may trigger a short trade at the upper trendline. CY could have been traded with similar strategy. According to Figure 1, CY moved away from the lower trendline in late February and mingled in a close vicinity of an upper trendline. Therefore, the upper trendline is a strong resistance for a bullish breakout. |
| In addition, a small doji and a comparatively large bearish candle with an upper and lower shadow indicates a bearish engulfing pattern. Hence, I would recommend to book profits at the current level and enter short below $5.75 with a stop-loss at $6.75. The stop-loss above the upper trendline would protect the trade. CY has not retraced toward the lower trendline since late February, so we have to observe the price action near $5.75. Considering the earlier price movement, the stock could bounce from $5.75 to the upper trendline. Hence, at these crucial resistance levels, profit-booking would be a wiser decision. Fresh short trades can be triggered below $5.75, but if CY breaks out, traders can initiate long positions above an upper trendline. |
Active trader in the Indian stock markets since 2003 and a full-time writer. Trading is largely based upon technical analysis.
| Company: | Independent |
| Address: | C1/3 Parth Indraprasth Towers. Vastrapur |
| Ahmedabad, Guj 380015 | |
| E-mail address: | chaitalimohile@yahoo.co.in |
Traders' Resource Links | |
| Independent has not added any product or service information to TRADERS' RESOURCE. | |
Click here for more information about our publications!
PRINT THIS ARTICLE

Request Information From Our Sponsors
- StockCharts.com, Inc.
- Candle Patterns
- Candlestick Charting Explained
- Intermarket Technical Analysis
- John Murphy on Chart Analysis
- John Murphy's Chart Pattern Recognition
- John Murphy's Market Message
- MurphyExplainsMarketAnalysis-Intermarket Analysis
- MurphyExplainsMarketAnalysis-Visual Analysis
- StockCharts.com
- Technical Analysis of the Financial Markets
- The Visual Investor
- VectorVest, Inc.
- Executive Premier Workshop
- One-Day Options Course
- OptionsPro
- Retirement Income Workshop
- Sure-Fire Trading Systems (VectorVest, Inc.)
- Trading as a Business Workshop
- VectorVest 7 EOD
- VectorVest 7 RealTime/IntraDay
- VectorVest AutoTester
- VectorVest Educational Services
- VectorVest OnLine
- VectorVest Options Analyzer
- VectorVest ProGraphics v6.0
- VectorVest ProTrader 7
- VectorVest RealTime Derby Tool
- VectorVest Simulator
- VectorVest Variator
- VectorVest Watchdog
