HOT TOPICS LIST
- MACD
- Fibonacci
- RSI
- Gann
- ADXR
- Stochastics
- Volume
- Triangles
- Futures
- Cycles
- Volatility
- ZIGZAG
- MESA
- Retracement
- Aroon
INDICATORS LIST
LIST OF TOPICS
PRINT THIS ARTICLE
by Donald W. Pendergast, Jr.
After jumping more than 100% since making the major October 2008 low, the Gold Bugs Index has spent several months in a bullish consolidation pattern.
Position: Accumulate
Donald W. Pendergast, Jr.
Donald W. Pendergast is a financial markets consultant who offers specialized services to stock brokers and high net worth individuals who seek a better bottom line for their portfolios.
PRINT THIS ARTICLE
KELTNER CHANNELS
The Gold Bugs Index And The Bullish Weekly Setup
03/23/09 01:47:01 PMby Donald W. Pendergast, Jr.
After jumping more than 100% since making the major October 2008 low, the Gold Bugs Index has spent several months in a bullish consolidation pattern.
Position: Accumulate
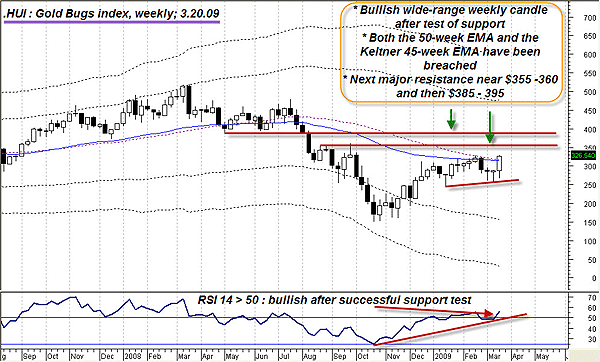
| One thing that gold bugs and non-gold bugs would likely agree on is the fact that gold stocks are among the most volatile, unpredictable, and violent of all. There are times that gold stocks rally when gold rises and falls when gold declines. Then there are times when gold equities get caught up in broad market updrafts and selloffs, delinking from the price action of gold for significant periods of time. One thing is for certain: you'll never have a dull moment if most of your stock portfolio is filled with the shares of mining names like Newmont (NEM), Agnico-Eagle (AEM), Kinross (KGC), and Yamana (AUY). As the Federal Reserve and the US Treasury unveiled more of their plan for further bailouts and economic stimulus spending last week, gold mining shares rose dramatically as traders began to pile into precious metals and their related mining shares with abandon. That's because such traders and investors believe that such massive, debt-laden spending plans will eventually lead to the kind of price inflation last witnessed from 1968 to 1981, a period that saw the price of gold rise more than 25-fold. Some gold mining stocks did even better than that, and apparently some big money is also willing to deploy significant amounts of cash into such investments today, fearing another massive bout of multidecade, chronic inflation. We'll look at the weekly chart of the Gold Bugs index (.HUI) to gain some more insight into the situation. See Figure 1. |

|
| FIGURE 1: HUI, WEEKLY. The .HUI appears to be building a platform from which to launch a new thrust toward higher levels. Key overhead resistances lie between $355-395. |
| Graphic provided by: MetaStock. |
| |
| Overall, the weekly Gold Bugs charts seem to present an image of a market engaged in a mild period of pause, in which it has enough time to catch its breath long enough to begin building a solid platform from which to launch to higher levels. Some technical features to note include the very bullish posture of the RSI (14); after stalling out and retesting the 50 area, it has turned sharply higher, putting it firmly into bullish territory. At the same time, last week's wide-range bullish candle, one appearing after a successful test of support near $255-260, has also broken above the 50-week exponential moving average (EMA) and the Keltner mid-line, based on a 45-week EMA. Of the two, the successful close above the Keltner mid-line is the most important; time and again this line in the sand helps to identify breakout moves and/or acts as support/resistance in consolidating markets. Given the recent action in the gold market, it would seem wise to err in favor of a breakout move higher in this case. Lest anyone gets too profit-giddy in case the breakout carries higher, the .HUI will face significant overhead resistance near $355-360 and then $385-395. |

|
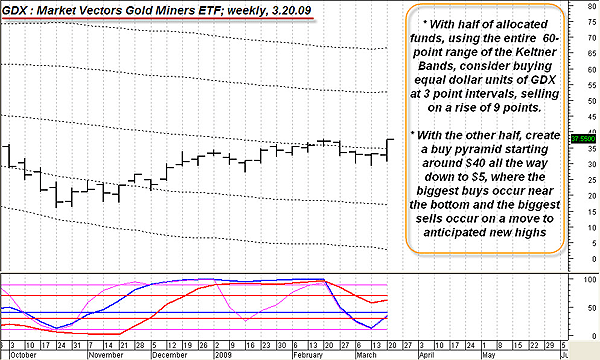
| FIGURE 2: GDX, WEEKLY. The Keltner bands may be able to provide a rough framework from which to construct a scale-trading regimen. A deep understanding of fundamental, seasonal and technical factors are a prerequisite for those engaging in this style of trading. |
| Graphic provided by: MetaStock. |
| Graphic provided by: WB EOD indicators from ProfitTrader for MetaStock. |
| |
| How might practical traders and investors play a continuation move higher out of this platform, anyway? For starters, since the .HUI essentially moves in synch with GDX, the Market Vectors Gold Miners exchange traded fund (ETF), going long shares of GDX on a break above last week's high could be one option. Riding half the position up to the first resistance, liquidating, and then holding the rest for a potential trip up toward $385-395 might be one plan of action. An initial stop-loss could be placed near $290, just below the daily 50-period EMA. That's a plain-vanilla trade setup, but what about a trade method that might be able to provide a band of profitability across a substantial range of GDX price points, areas framed out by the weekly Keltner bands? Let's have a look at this trading method, being sure to carefully weigh the tradeoff between risk and reward. |
| Let's assume you are biased toward a major bull market in gold and gold mining shares but are hesitant to attempt to pick entry and exit points. Why not take a limited amount of capital and attempt to cover all bets by buying equal dollar amounts of GDX at equal intervals between $60 and $6, taking profits every time x number of profit points are attained? For example, you have $8,000 to allocate in equal dollar amounts at $60, $57, $54, $51 ... all the way down to $6 (remember, gold mining shares are volatile!). In this case, you'd be allocating approximately $420 at each of those 19 buy points, with the plan being to hopefully take profits when x number of profit points are achieved by each particular buy. It's a very mechanical way to trade, one based on arithmetic relationships instead of technical analysis. You could also create an inverted pyramid, perhaps ranging from $42 down to $6. With $8,000 to deploy, you'd only purchase a minimal number of shares at $42, progressively buying larger share allocations at each descending buy point. By the time the $6 level is reached (if ever), 100 times as many shares might be purchased. On this pyramid, what you're hoping for is a move back up past the former highs, hoping to unload the $6 position in the $40 range, hoping to score a major capital gain. Then, as price rises, continue to sell the remaining positions into strength. |
| Are there risks with scale trading methods like these? Of course there are. For example, what if GDX really did plunge back toward $6 from $42? Would your bullish bias still exist? Could you really buy all the way down, knowing that the gold bull market might be dying in front of your eyes, with no real rebound possible for years? Realistically, scale trading methods should only be deployed when a trader has a means of identifying extremely strong support levels (from a higher time frame) that are below a fundamentally bullish tradable's current price. Seasonal, technical, and fundamental factors should all be given adequate consideration when constructing scale ladders to ensure that a trader has the odds in his favor before employing such atypical trading methods. |
Donald W. Pendergast is a financial markets consultant who offers specialized services to stock brokers and high net worth individuals who seek a better bottom line for their portfolios.
| Title: | Writer, market consultant |
| Company: | Linear Trading Systems LLC |
| Jacksonville, FL 32217 | |
| Phone # for sales: | 904-239-9564 |
| E-mail address: | lineartradingsys@gmail.com |
Traders' Resource Links | |
| Linear Trading Systems LLC has not added any product or service information to TRADERS' RESOURCE. | |
Click here for more information about our publications!
Comments
Date: 03/23/09Rank: 4Comment:
Date: 03/23/09Rank: 4Comment:

Request Information From Our Sponsors
- StockCharts.com, Inc.
- Candle Patterns
- Candlestick Charting Explained
- Intermarket Technical Analysis
- John Murphy on Chart Analysis
- John Murphy's Chart Pattern Recognition
- John Murphy's Market Message
- MurphyExplainsMarketAnalysis-Intermarket Analysis
- MurphyExplainsMarketAnalysis-Visual Analysis
- StockCharts.com
- Technical Analysis of the Financial Markets
- The Visual Investor
- VectorVest, Inc.
- Executive Premier Workshop
- One-Day Options Course
- OptionsPro
- Retirement Income Workshop
- Sure-Fire Trading Systems (VectorVest, Inc.)
- Trading as a Business Workshop
- VectorVest 7 EOD
- VectorVest 7 RealTime/IntraDay
- VectorVest AutoTester
- VectorVest Educational Services
- VectorVest OnLine
- VectorVest Options Analyzer
- VectorVest ProGraphics v6.0
- VectorVest ProTrader 7
- VectorVest RealTime Derby Tool
- VectorVest Simulator
- VectorVest Variator
- VectorVest Watchdog
