HOT TOPICS LIST
- MACD
- Fibonacci
- RSI
- Gann
- ADXR
- Stochastics
- Volume
- Triangles
- Futures
- Cycles
- Volatility
- ZIGZAG
- MESA
- Retracement
- Aroon
INDICATORS LIST
LIST OF TOPICS
PRINT THIS ARTICLE
by Koos van der Merwe
Those readers who have children, and have been on a car trip with the kids sitting in the back seat, know the answer to this question. Unfortunately, it appears that most investors do not.
Position: Accumulate
Koos van der Merwe
Has been a technical analyst since 1969, and has worked as a futures and options trader with First Financial Futures in Johannesburg, South Africa.
PRINT THIS ARTICLE
ELLIOTT WAVE
Are We There Yet?
03/24/09 11:34:05 AMby Koos van der Merwe
Those readers who have children, and have been on a car trip with the kids sitting in the back seat, know the answer to this question. Unfortunately, it appears that most investors do not.
Position: Accumulate
| After he was elected in 1932, President Franklin D. Roosevelt held a fireside chat over the radio to assure the American people that he would do everything in his power to restore confidence in their financial system and provide jobs. President Barack Obama has taken a leaf out of President Roosevelt's book, but rather than talk on the radio, he appears on late-night television shows to reach the American public, and assure them that the budget he has prepared will work, and to their benefit. The result? The last few days we have seen the Dow Jones Industrial Average (DJIA) recover. The question, of course, is for how long will this continue? |

|
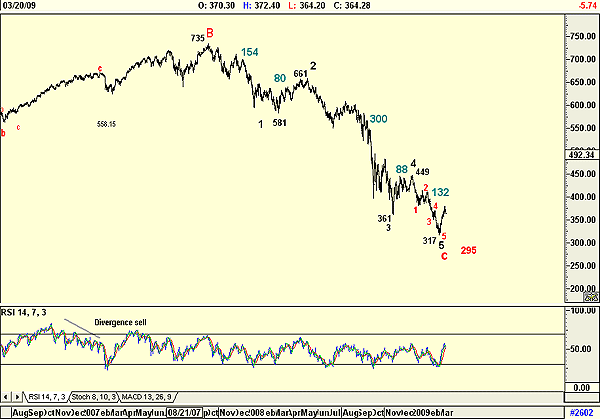
| FIGURE 1: S&P 100. S&P 100 shows wave counts. |
| Graphic provided by: AdvancedGET. |
| |
| Figure 1 is the daily Standard & Poor's 100. This chart shows what we believe is the fifth-wave bottom of the major bear market wave C. The relative strength index (RSI) giving a buy signal also suggests that this could be the case. However, the wave lengths are a concern. The wave of wave C is shown on the chart. As a percentage of wave 1: Wave 1 = 154 (735 - 581 = 154) 100% Wave 2 = 80 (661 - 581 = 80) 52% Wave 3 = 300 (661 - 361 = 300) 195% Wave 4 = 88 (449 - 361 = 88) 57% Wave 5 = 132 (449 - 317 = 132) 86% Elliott wave theory says that wave 4 should be equal to wave 1; 88 is close enough to 80 to be acceptable. Wave 3 should not be less than wave 1 and should be a Fibonacci ratio of wave 1. Well, 195% is close enough to 200% (2) to be acceptable. The problem lies with wave 5, which should be equal or longer than wave 1. Wave 5 is only 86% of wave 1, suggesting that the low of wave 5 should be in the region of 295. Does this mean that the S&P 100 can go lower? To answer this question, I look at the next chart, which is an enlargement of wave 5 of the daily chart. |

|
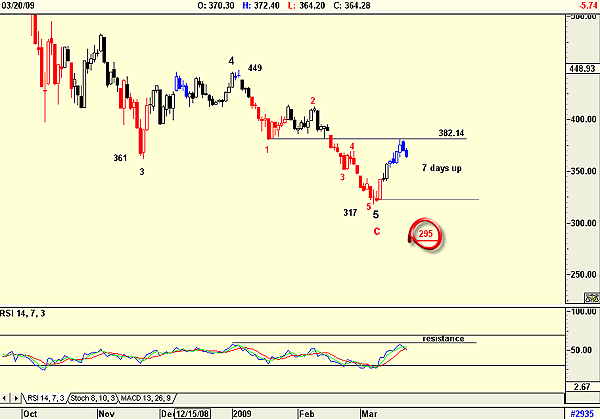
| FIGURE 2: S&P 100. S&P 100 suggests a possible low target — or not. |
| Graphic provided by: AdvancedGET. |
| |
| Figure 2 shows how the recent seven-day rise in the S&P 100 found resistance at the low of wave 1 of wave 5 at 382.14. W.D. Gann noted that a daily/hourly/minute/second impulse wave rises in seven periods and then corrects in three periods, before starting a new seven-period rise. We should therefore now expect a three-day correction before a further seven-day rise if indeed the S&P 100 is in a new bull trend. This rise should occur around March 23. Do note that March 22 is the solstice, a date that Gann always respected as a reliable cyclical indicator. From Gann Made Easy by William McLaren: "This is the date when the sun crosses the equator and spring begins. The spring rally in the stock market often starts around this date or culminates if stocks have been advancing previous to this date." |
| The question now is what happens on March 24. March 23 should see the S&P 100 open in the negative, but finish the day in the positive. Should this occur, we can be assured that the next seven days should be positive, confirming the new bull market. However, should March 24, 25, and 26 continue negative, then we can expect a continuation of the bear trend possible to find a low at 295. Should this happen, we will see a very strong divergence buy in the RSI. Are we there yet? Yes ... but we are looking for a place to park. |
Has been a technical analyst since 1969, and has worked as a futures and options trader with First Financial Futures in Johannesburg, South Africa.
| Address: | 3256 West 24th Ave |
| Vancouver, BC | |
| Phone # for sales: | 6042634214 |
| E-mail address: | petroosp@gmail.com |
Click here for more information about our publications!
Comments
Date: 03/24/09Rank: 4Comment:

Request Information From Our Sponsors
- VectorVest, Inc.
- Executive Premier Workshop
- One-Day Options Course
- OptionsPro
- Retirement Income Workshop
- Sure-Fire Trading Systems (VectorVest, Inc.)
- Trading as a Business Workshop
- VectorVest 7 EOD
- VectorVest 7 RealTime/IntraDay
- VectorVest AutoTester
- VectorVest Educational Services
- VectorVest OnLine
- VectorVest Options Analyzer
- VectorVest ProGraphics v6.0
- VectorVest ProTrader 7
- VectorVest RealTime Derby Tool
- VectorVest Simulator
- VectorVest Variator
- VectorVest Watchdog
- StockCharts.com, Inc.
- Candle Patterns
- Candlestick Charting Explained
- Intermarket Technical Analysis
- John Murphy on Chart Analysis
- John Murphy's Chart Pattern Recognition
- John Murphy's Market Message
- MurphyExplainsMarketAnalysis-Intermarket Analysis
- MurphyExplainsMarketAnalysis-Visual Analysis
- StockCharts.com
- Technical Analysis of the Financial Markets
- The Visual Investor
