

HOT TOPICS LIST
- MACD
- Fibonacci
- RSI
- Gann
- ADXR
- Stochastics
- Volume
- Triangles
- Futures
- Cycles
- Volatility
- ZIGZAG
- MESA
- Retracement
- Aroon
INDICATORS LIST
LIST OF TOPICS
PRINT THIS ARTICLE
by Chaitali Mohile
Since October 2008, ImmunoGen has been in a bullish mood. After an extensive advance rally, the price movement is likely to slow down. What should your action plan be in the current technical conditions?
Position: N/A
Chaitali Mohile
Active trader in the Indian stock markets since 2003 and a full-time writer. Trading is largely based upon technical analysis.
PRINT THIS ARTICLE
TECHNICAL ANALYSIS
ImmunoGen Surges Above Resistance
03/20/09 10:02:51 AMby Chaitali Mohile
Since October 2008, ImmunoGen has been in a bullish mood. After an extensive advance rally, the price movement is likely to slow down. What should your action plan be in the current technical conditions?
Position: N/A
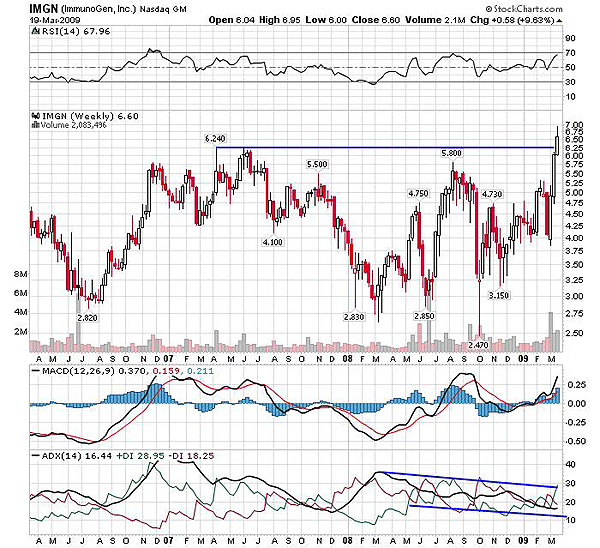
| ImmunoGen (IMGN) began its bullish journey in October 2008. Although the rally was highly volatile, IMGN managed to break through the various resistance levels and finally reached a 52-week high in March. The volatility is indicated by the moving average convergence/divergence (MACD) (12,26,9) in Figure 1. The oscillator is hugging the trigger line in positive territory, indicating an unstable bullish rally. Above the 52-week high, the stock surged higher toward the previous high resistances at $5.80 and $6.24. The two long bullish candles in Figure 1 indicated the bullish sentiments of the traders. The relative strength index (RSI) (14) established support at 50 levels, indicating a bullish strength in the rally. |
|
| FIGURE 1: IMGN, WEEKLY. IMGN has established the support above the historical highs of 2007 and 2008. |
| Graphic provided by: StockCharts.com. |
| |
| On March 16, IMGN opened near the previous week's high and showed the possibility of constructing the three white soldiers candlestick pattern. Currently, the stock has established a strong support at the previous high resistance of $6.240. Though the RSI (14) is ranged in an oversold zone between 50 and 70, the average directional movement index (ADX) (14) has declined below the 20 level, so the trend was very weak to support the upside rally. As a result, IMGN has moved below the current week's high of $6.95. Therefore, on a weekly time frame in Figure 1, the three white soldiers, a bullish reversal pattern, is under threat. For trading perspective, let's refer the daily time frame. |
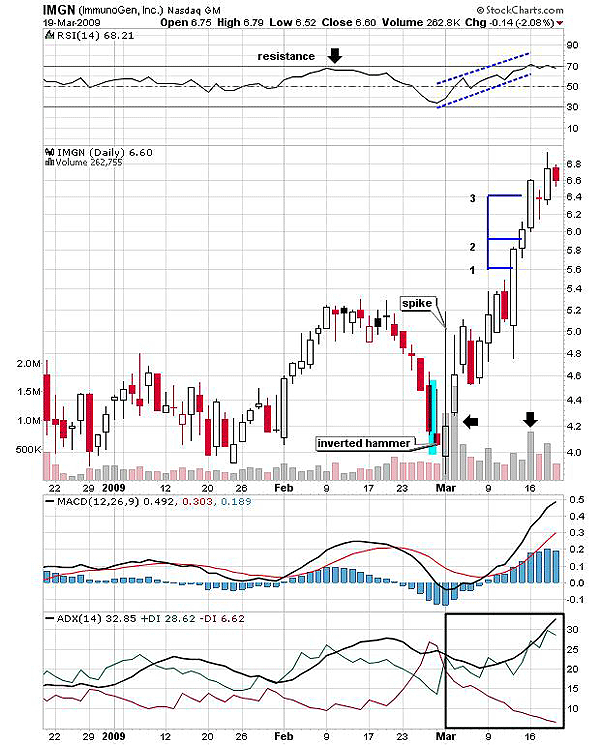
| According to Figure 2, IMGN entered an intermediate uptrend in early March. An inverted hammer that formed in February was the first bullish reversal indication on the daily time frame. The following candle of March 2 hit the February high and slipped down, forming a long upper shadow (spike). The increased volume supported an upside move. Gradually, the rally turned stronger and converted the previous resistance (February) to the support. IMGN gained additional strength when the RSI (14) rushed above the golden support level at 50 (see Figure 2). At this point, the RSI (14) offered a confirmed buy signal for the traders. Thereafter, the stock moved higher and higher. So the long trade that was triggered after the RSI breakout moved in profit. |
|
| FIGURE 2: IMGN, DAILY. The inverted hammer formed in February gave an early indication for the trend reversal. The stock entered an intermediate uptrend in early March. |
| Graphic provided by: StockCharts.com. |
| |
| The numbered candles in Figure 2 reflected the bullish pressure in the stock. The ADX (14) indicated the developing uptrend and the MACD (12,26,9) was positive. So both bullish indicators can pull IMGN upward. But the RSI (14) has reached an overbought level at 70. Earlier, the indicator formed a rounded-top bearish reversal pattern and plunged to 30. Therefore, 70 levels is the strong resistance for the current rally and we cannot overlook the reversal possibility of the momentum indicator. This could stall the rally, and the stock could consolidate. Hence, I would recommend traders book partial profit at the current level. Another reason for profit booking is an extended advance rally that may change direction at any point. |
| The overall scenario suggests that IMGN may enter the sideways consolidation but may not decline. The indicators on both time frames are partially bullish and could help IMGN sustain above its previous high. |
Active trader in the Indian stock markets since 2003 and a full-time writer. Trading is largely based upon technical analysis.
| Company: | Independent |
| Address: | C1/3 Parth Indraprasth Towers. Vastrapur |
| Ahmedabad, Guj 380015 | |
| E-mail address: | chaitalimohile@yahoo.co.in |
Traders' Resource Links | |
| Independent has not added any product or service information to TRADERS' RESOURCE. | |
Click here for more information about our publications!
PRINT THIS ARTICLE

Request Information From Our Sponsors
- StockCharts.com, Inc.
- Candle Patterns
- Candlestick Charting Explained
- Intermarket Technical Analysis
- John Murphy on Chart Analysis
- John Murphy's Chart Pattern Recognition
- John Murphy's Market Message
- MurphyExplainsMarketAnalysis-Intermarket Analysis
- MurphyExplainsMarketAnalysis-Visual Analysis
- StockCharts.com
- Technical Analysis of the Financial Markets
- The Visual Investor
- VectorVest, Inc.
- Executive Premier Workshop
- One-Day Options Course
- OptionsPro
- Retirement Income Workshop
- Sure-Fire Trading Systems (VectorVest, Inc.)
- Trading as a Business Workshop
- VectorVest 7 EOD
- VectorVest 7 RealTime/IntraDay
- VectorVest AutoTester
- VectorVest Educational Services
- VectorVest OnLine
- VectorVest Options Analyzer
- VectorVest ProGraphics v6.0
- VectorVest ProTrader 7
- VectorVest RealTime Derby Tool
- VectorVest Simulator
- VectorVest Variator
- VectorVest Watchdog