HOT TOPICS LIST
- MACD
- Fibonacci
- RSI
- Gann
- ADXR
- Stochastics
- Volume
- Triangles
- Futures
- Cycles
- Volatility
- ZIGZAG
- MESA
- Retracement
- Aroon
INDICATORS LIST
LIST OF TOPICS
PRINT THIS ARTICLE
by Donald W. Pendergast, Jr.
The Internet retail industry group has high relative strength versus the S&P 500, and Amazon.com is among the strongest within the group.
Position: Accumulate
Donald W. Pendergast, Jr.
Donald W. Pendergast is a financial markets consultant who offers specialized services to stock brokers and high net worth individuals who seek a better bottom line for their portfolios.
PRINT THIS ARTICLE
ACCUM./DIST. CHAIKIN
Amazon.com: A Pause Before Moving Even Higher?
03/20/09 08:52:40 AMby Donald W. Pendergast, Jr.
The Internet retail industry group has high relative strength versus the S&P 500, and Amazon.com is among the strongest within the group.
Position: Accumulate
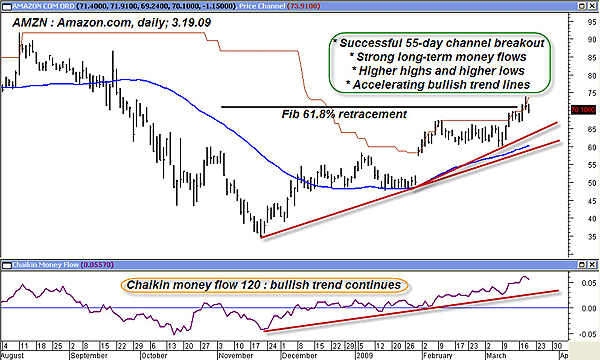
| Ten years ago, most people would have said something like "Amazon what?" Times have changed, with the Internet retail giant having achieved consistent profitability earlier this decade. Lately, Amazon.com (AMZN) shares have been doing very well, consistently outperforming the broad market indexes since bottoming out in November 2008. The question now is this: does this stock have more room to run, or is it time for a trend reversal? An examination of AMZN's daily graph (Figure 1) might provide us with some clues. |

|
| FIGURE 1: AMZN, DAILY. Strong relative strength stocks tend to outperform for some time, as shown by Amazon's recent performance. The next significant resistance areas are near $80 and $90, respectively. |
| Graphic provided by: MetaStock. |
| |
| Technically, AMZN presents a very appealing picture — a consistent series of higher highs and higher lows, a steadily rising Chaikin money flow (CMF)(120) and a recent bullish breakaway gap, followed by a consolidation phase that morphed into a successful bullish pennant breakout. So what's next for this strongly trending stock and how might we play it to our advantage? |
| Given this stock's strong 13-week relative strength and the tendency for high relative strength stocks to outperform for some time, selling covered calls to generate monthly income might be a viable strategy. Selling an April $70 call against every 100 shares of AMZN would entitle the seller to receive $500 in option premiums. You'll see on the chart that AMZN briefly rose above the Fibonacci 61.8% resistance line. If price continues higher, it's a pretty good sign that the stock will make a run up toward the next Fibonacci retracement (the 78.6% level) near $80. For risk control purposes, consider bailing out of the trade if prices fall back below $66, which is just beneath the most recent uptrend line. Given the massive wave of capitulation that has occurred over the past two weeks, it's highly likely that AMZN will continue higher, but wise traders will set a stop-loss anyway, just in case. |
| Relative strength comparisons are a wonderful technical tool, one that can help you find the best places to deploy capital in anticipation of a profitable outcome. Focusing on high relative strength stocks that also have favorable long-term money flows can help you hone your stock screening process to a razor-sharp edge. This method tends to work just as well to find the weakest stocks with the weakest long-term money flows. Either way, this kind of filtering can help to keep you on the right side of most markets, most of the time. |
Donald W. Pendergast is a financial markets consultant who offers specialized services to stock brokers and high net worth individuals who seek a better bottom line for their portfolios.
| Title: | Writer, market consultant |
| Company: | Linear Trading Systems LLC |
| Jacksonville, FL 32217 | |
| Phone # for sales: | 904-239-9564 |
| E-mail address: | lineartradingsys@gmail.com |
Traders' Resource Links | |
| Linear Trading Systems LLC has not added any product or service information to TRADERS' RESOURCE. | |
Click here for more information about our publications!
Comments
Date: 03/23/09Rank: 5Comment:

Request Information From Our Sponsors
- VectorVest, Inc.
- Executive Premier Workshop
- One-Day Options Course
- OptionsPro
- Retirement Income Workshop
- Sure-Fire Trading Systems (VectorVest, Inc.)
- Trading as a Business Workshop
- VectorVest 7 EOD
- VectorVest 7 RealTime/IntraDay
- VectorVest AutoTester
- VectorVest Educational Services
- VectorVest OnLine
- VectorVest Options Analyzer
- VectorVest ProGraphics v6.0
- VectorVest ProTrader 7
- VectorVest RealTime Derby Tool
- VectorVest Simulator
- VectorVest Variator
- VectorVest Watchdog
- StockCharts.com, Inc.
- Candle Patterns
- Candlestick Charting Explained
- Intermarket Technical Analysis
- John Murphy on Chart Analysis
- John Murphy's Chart Pattern Recognition
- John Murphy's Market Message
- MurphyExplainsMarketAnalysis-Intermarket Analysis
- MurphyExplainsMarketAnalysis-Visual Analysis
- StockCharts.com
- Technical Analysis of the Financial Markets
- The Visual Investor
