HOT TOPICS LIST
- MACD
- Fibonacci
- RSI
- Gann
- ADXR
- Stochastics
- Volume
- Triangles
- Futures
- Cycles
- Volatility
- ZIGZAG
- MESA
- Retracement
- Aroon
INDICATORS LIST
LIST OF TOPICS
PRINT THIS ARTICLE
by Chaitali Mohile
XLU is undergoing a pullback rally in a highly bearish trend. The size of candlesticks along with the indicators on the chart of the stock will help identify the strength in the rally.
Position: Buy
Chaitali Mohile
Active trader in the Indian stock markets since 2003 and a full-time writer. Trading is largely based upon technical analysis.
PRINT THIS ARTICLE
CANDLESTICK CHARTING
XLU Rally Is Getting Stronger
03/19/09 11:39:39 AMby Chaitali Mohile
XLU is undergoing a pullback rally in a highly bearish trend. The size of candlesticks along with the indicators on the chart of the stock will help identify the strength in the rally.
Position: Buy
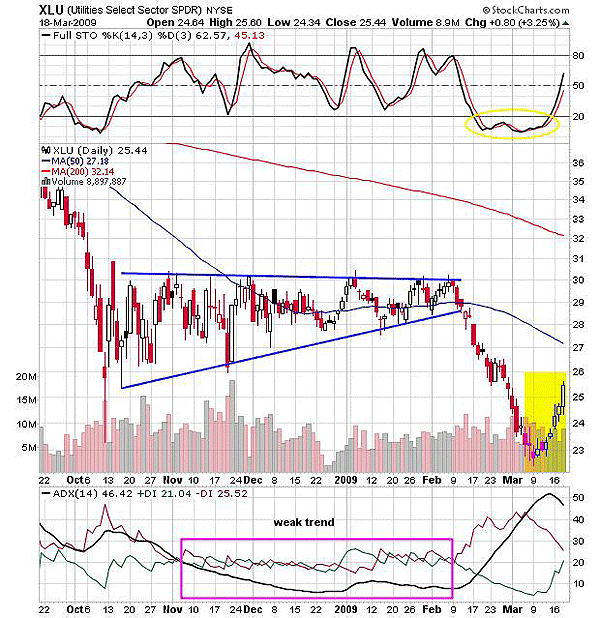
| After a bearish breakout, an ascending triangular pattern formed by the Utilities Select Sector SPDR (XLU) failed. The weak average directional movement index (ADX) (14) in Figure 1 rushed above 20 levels with a huge selling pressure, indicating a developing downtrend. The downtrend turned stronger with every declining price level. The oversold stochastic (14,3,3) continued moving in the same territory, even after the breakout. This indicated a positive divergence, suggesting a bullish rally under way. The trend indicator gradually moved in an overheated zone, indicating a robust downtrend. |
| The positive divergence of the stochastic (14,3,3) and the highly overheated ADX (14) initiated a bullish rally on March 10. Earlier, the rally was weak due to the high volatility and low volumes. In Figure 1, the small candles at the beginning of the rally indicated weakness. However, as the stochastic (14,3,3) surged above an oversold level at 20, bigger candles were formed. The size of candles reflects the trader's psychology and, therefore, helps to identify the strength in the rally. The declining ADX (14) from the overheated level encouraged traders to initiate the fresh long positions. |

|
| FIGURE 1: XLU, DAILY. The positive divergence on the stochastic (14,3,3) and the overheated downtrend encouraged the pullback rally. The yellow rectangle shows the increasing size of candlesticks. |
| Graphic provided by: StockCharts.com. |
| |
| When shadows appear at the higher and lower ends of the candles, that shows that the stock is unable to sustain near the high or low of the candle. The shadows on the candles formed recently have diminished gradually. The candle formed on March 18 is bullish with very small shadows. This suggests that the strong bullish rally is developing. |
| Therefore, the rally is gaining strength and is likely to hit the 50-day moving average resistance (MA). Since the 50-day MA is declining, we need to take the profit carefully, because XLU might change the direction or consolidate under the resistance. Currently, the stochastic oscillator has moved the 50 level, indicating positive momentum. So with a short-term perspective, XLU might soon reach its declining resistance. |
| This rally is a temporary pullback due to oversold market conditions. Hence, it is necessary to keep a short-term view on the long trades and consider taking fast profits. |
Active trader in the Indian stock markets since 2003 and a full-time writer. Trading is largely based upon technical analysis.
| Company: | Independent |
| Address: | C1/3 Parth Indraprasth Towers. Vastrapur |
| Ahmedabad, Guj 380015 | |
| E-mail address: | chaitalimohile@yahoo.co.in |
Traders' Resource Links | |
| Independent has not added any product or service information to TRADERS' RESOURCE. | |
Click here for more information about our publications!
PRINT THIS ARTICLE

Request Information From Our Sponsors
- StockCharts.com, Inc.
- Candle Patterns
- Candlestick Charting Explained
- Intermarket Technical Analysis
- John Murphy on Chart Analysis
- John Murphy's Chart Pattern Recognition
- John Murphy's Market Message
- MurphyExplainsMarketAnalysis-Intermarket Analysis
- MurphyExplainsMarketAnalysis-Visual Analysis
- StockCharts.com
- Technical Analysis of the Financial Markets
- The Visual Investor
- VectorVest, Inc.
- Executive Premier Workshop
- One-Day Options Course
- OptionsPro
- Retirement Income Workshop
- Sure-Fire Trading Systems (VectorVest, Inc.)
- Trading as a Business Workshop
- VectorVest 7 EOD
- VectorVest 7 RealTime/IntraDay
- VectorVest AutoTester
- VectorVest Educational Services
- VectorVest OnLine
- VectorVest Options Analyzer
- VectorVest ProGraphics v6.0
- VectorVest ProTrader 7
- VectorVest RealTime Derby Tool
- VectorVest Simulator
- VectorVest Variator
- VectorVest Watchdog
