HOT TOPICS LIST
- MACD
- Fibonacci
- RSI
- Gann
- ADXR
- Stochastics
- Volume
- Triangles
- Futures
- Cycles
- Volatility
- ZIGZAG
- MESA
- Retracement
- Aroon
INDICATORS LIST
LIST OF TOPICS
PRINT THIS ARTICLE
by Donald W. Pendergast, Jr.
Sun Microsystems stock rose 79% on word that IBM had offered $6.5 billion in cash to acquire the Silicon Valley tech giant.
Position: Accumulate
Donald W. Pendergast, Jr.
Donald W. Pendergast is a financial markets consultant who offers specialized services to stock brokers and high net worth individuals who seek a better bottom line for their portfolios.
PRINT THIS ARTICLE
BREAKAWAY GAP
JAVA Shares Jump On IBM's $6.5 Billion Offer
03/19/09 08:35:34 AMby Donald W. Pendergast, Jr.
Sun Microsystems stock rose 79% on word that IBM had offered $6.5 billion in cash to acquire the Silicon Valley tech giant.
Position: Accumulate
| Before the news hit the wires, the daily and weekly charts of Sun Microsystems (JAVA) weren't anything worth a second glance. For all intents and purposes, the charts revealed the troubled state of affairs for this firm, which was one of NASDAQ's high-fliers during the 1990s tech boom/bubble phase. Now, with word of IBM's offer to acquire the company, these charts have gotten a lot more interesting. See Figures 1 and 2. |

|
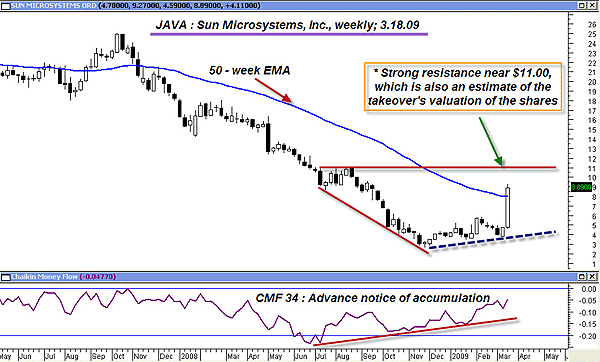
| FIGURE 1: JAVA, WEEKLY. While the weekly Chaikin money flow (CMF) (34) gave plenty of notice of a likely trend reversal, the future trajectory of this stock is much less certain, being more dependent on "high-finance" dealing than raw technical analysis. |
| Graphic provided by: MetaStock. |
| |
| While full terms of IBM's prospective offer aren't widely known right now, some analysts have calculated that IBM's offer equals a JAVA share price of $10–11 per share, quite a bit higher than today's closing price of $8.89. The technicals on the weekly chart are dwarfed in comparison to the huge, wide-range candle, one that has just pierced the 50-week exponential moving average (EMA) line. Interestingly, there is heavy overhead resistance (Fibonacci and otherwise) near the $11 area, which also coincides with the upper share valuation estimate based on IBM's generous cash offer for JAVA. Astute technicians watching the JAVA weekly chart would also have been aware of the bullish price–money flow divergence that began to take shape in the summer of 2008; even as prices continued to fall, the Chaikin money flow (CMF) (34) began to rise, alerting the insightful that the big money was building a position in the company's shares. Such divergences don't always play out right away (if at all), but it's uncanny how often that money flow divergences precede substantial trend reversals. |

|
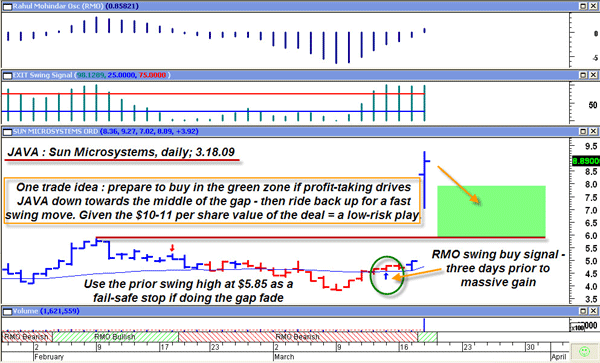
| FIGURE 2: JAVA, DAILY. Buying a pullback toward the middle of the gap might allow swift swing traders the opportunity to profit on a variety of daily/intraday stock and option trades. |
| Graphic provided by: MetaStock. |
| Graphic provided by: Rahul Mohindar indicators from MetaStock v 10. |
| |
| The JAVA daily chart (Figure 2) provides greater detail for the one-day breakaway gap; there's a $2.05 distance across the gap, which is enormous for such a low-priced issue. Three sessions before the gap, the Rahul Mohindar oscillator (RMO) swing trade buy signal flashed a buy just after the stock cleared its 50-day EMA; obviously, it was a superior trade signal, but who knew how sharply that JAVA would rise on the news to follow? Not many. Regardless, now we're left with the decision of what to do with this potential trade setup. Fade it? Buy tomorrow on a break to a new high? Just watch? Here's an idea: many times, after a windfall profit move like this, a market will sell off quickly as nervous sellers rapidly sell to lock in most of their profits. While that makes sense for them, it also opens up a potential for others to acquire the stock as it pulls back. In this case, with the deal valuing the stock $1 to $2 higher than today's close, shrewd traders will watch to see if the sellers get overly aggressive, bringing the stock back down toward the lower end of the gap. If no further news is released (no news is good news) regarding the deal, a pullback might offer the chance to enter in hopes of a sharp swing back higher. One way to do this is with an in-the-money (ITM) call option, say, a JAVA call option with at least four to eight weeks until expiration that has a delta of 0.80 or higher. Option implied volatility is very high now, but buying a ITM call with such a high delta will help guard against losses caused by a sudden collapse in volatility and/or a price reversal. Time decay also becomes less of a factor (within reason) on long options with high deltas. If you can time an entry on a pullback, setting your bailout stop on a drop below $5.85 (red horizontal line), the next step is to hold on for a snap higher. Since such an option has a high delta, it wouldn't take much of a move for such an option to begin moving point for point with the stock. A 70% to 80% gain in the option should be a signal to close half of the position, trailing the rest with a fairly close stop. |
| There are really three support levels that matter for those considering buying on pullbacks. The first is the March 18, 2009, low at $7.02, which is the top of the gap. The next is the prior swing high at $5.85. The last one is the bottom of the gap at $4.97. Good tradable setups will likely abound for intraday traders (using three- to 10-minute charts) at the first two support levels. Option buyers will want to focus more on daily reversals within the green shaded area. If the gap gets filled rapidly, that's a negative sign that this deal is in trouble or that the markets have had a change of heart regarding the whole shebang. |
Donald W. Pendergast is a financial markets consultant who offers specialized services to stock brokers and high net worth individuals who seek a better bottom line for their portfolios.
| Title: | Writer, market consultant |
| Company: | Linear Trading Systems LLC |
| Jacksonville, FL 32217 | |
| Phone # for sales: | 904-239-9564 |
| E-mail address: | lineartradingsys@gmail.com |
Traders' Resource Links | |
| Linear Trading Systems LLC has not added any product or service information to TRADERS' RESOURCE. | |
Click here for more information about our publications!
PRINT THIS ARTICLE

Request Information From Our Sponsors
- VectorVest, Inc.
- Executive Premier Workshop
- One-Day Options Course
- OptionsPro
- Retirement Income Workshop
- Sure-Fire Trading Systems (VectorVest, Inc.)
- Trading as a Business Workshop
- VectorVest 7 EOD
- VectorVest 7 RealTime/IntraDay
- VectorVest AutoTester
- VectorVest Educational Services
- VectorVest OnLine
- VectorVest Options Analyzer
- VectorVest ProGraphics v6.0
- VectorVest ProTrader 7
- VectorVest RealTime Derby Tool
- VectorVest Simulator
- VectorVest Variator
- VectorVest Watchdog
- StockCharts.com, Inc.
- Candle Patterns
- Candlestick Charting Explained
- Intermarket Technical Analysis
- John Murphy on Chart Analysis
- John Murphy's Chart Pattern Recognition
- John Murphy's Market Message
- MurphyExplainsMarketAnalysis-Intermarket Analysis
- MurphyExplainsMarketAnalysis-Visual Analysis
- StockCharts.com
- Technical Analysis of the Financial Markets
- The Visual Investor
