HOT TOPICS LIST
- MACD
- Fibonacci
- RSI
- Gann
- ADXR
- Stochastics
- Volume
- Triangles
- Futures
- Cycles
- Volatility
- ZIGZAG
- MESA
- Retracement
- Aroon
INDICATORS LIST
LIST OF TOPICS
PRINT THIS ARTICLE
by Chaitali Mohile
The momentum indicators of the Russell 3000 Value iShares are highly oversold. The price chart shows a bullish candlestick formation and potential target for the relief rally.
Position: N/A
Chaitali Mohile
Active trader in the Indian stock markets since 2003 and a full-time writer. Trading is largely based upon technical analysis.
PRINT THIS ARTICLE
OVERBOUGHT OVERSOLD
IWW Is Oversold
03/18/09 01:18:37 PMby Chaitali Mohile
The momentum indicators of the Russell 3000 Value iShares are highly oversold. The price chart shows a bullish candlestick formation and potential target for the relief rally.
Position: N/A
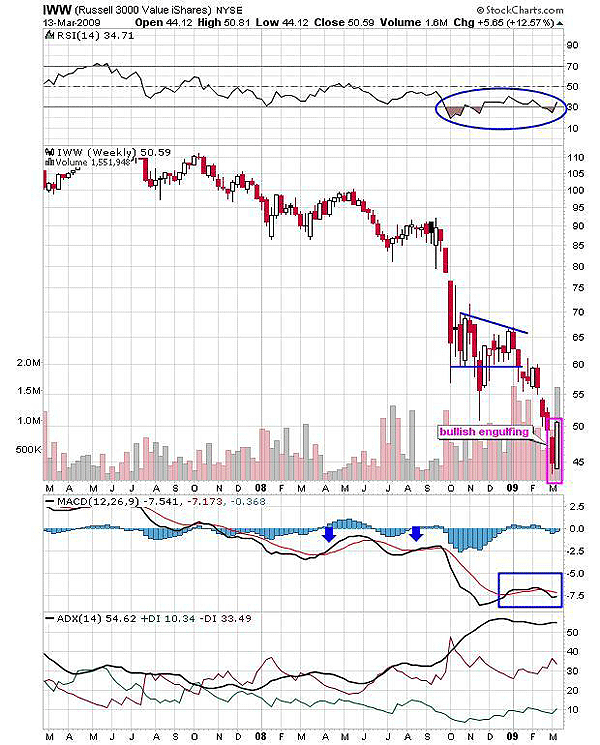
| The correction in the Russell 3000 Value iShare (IWW) was healthy till the 85-90 levels were hit. The relief rallies following every declining move formed the lower highs. The correction turned worse in September 2008 when the IWW took a nosedive from $90 to $60. As a result, a developing downtrend of IWW turned stronger. The average directional movement index (ADX) (14) in Figure 1 surged above 30 after the freefall. The price then consolidated in a wide range of $60 and $70, forming a bearish flag & pennant formation. This pattern is a bearish continuation pattern that resumes the prior declining rally after the breakout. The potential target on this bearish formation is calculated as 30 (breakout level 60 - the flagpole size 30= 30). In Figure 1, we can see that IWW has moved closer to the minimum estimated levels. |

|
| FIGURE 1: IWW, WEEKLY. The indicators have reached their highly bearish levels that might give birth to the relief rally. The bullish engulfing pattern formed at the bottom suggests an upside rally. |
| Graphic provided by: StockCharts.com. |
| |
| However, the heavily oversold relative strength index (RSI) (14) is likely to restrict the declining rally. The ADX (14) is indicating a highly overheated downtrend at the level of 54. The oversold RSI (14) and an overheated downtrend are indicating the possibility of a relief rally. In addition, the bullish engulfing pattern on the price chart in Figure 1 reconfirms the bullish rally in the current downtrend. The moving average convergence/divergence (MACD) (12,26,9) is indicating a high volatility throughout the downside move. The blue arrows and a rectangle marked in this momentum oscillator shows that the MACD line is unable to sustain above the trigger line. The highly bearish RSI (14), ADX (14), and the bullish engulfing candlestick pattern together are suggesting an upside rally. |

|
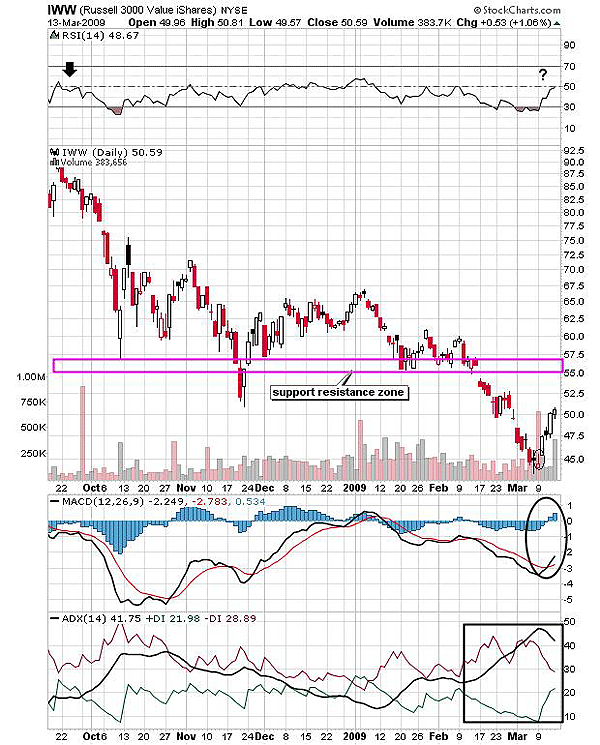
| FIGURE 2: IWW, DAILY. The support-resistance zone will be the potential target for the relief rally. |
| Graphic provided by: StockCharts.com. |
| |
| The RSI (14) has already surged from an oversold territory toward the 50 levels. Traders could initiate a long trade if the golden level of 50 is breached. In addition, the bullish strength would also increase after this breakout (RSI moving above 50). Therefore, this breakout is highly important for the stability of the rally. |
| The support-resistance zone on the price chart in Figure 2 should be considered as the potential target for the relief rally. A small inverted hammer was formed at the bottom before initiating the bullish move. The bullish crossover of the MACD (12,26,9), and the declining overheated downtrend indicated by the ADX (14) would fuel the buying pressure during the relief rally. |
| Thus, IWW is ready to undergo an upside swing in a current long-term downtrend. The target for the rally could be $55-57. |
Active trader in the Indian stock markets since 2003 and a full-time writer. Trading is largely based upon technical analysis.
| Company: | Independent |
| Address: | C1/3 Parth Indraprasth Towers. Vastrapur |
| Ahmedabad, Guj 380015 | |
| E-mail address: | chaitalimohile@yahoo.co.in |
Traders' Resource Links | |
| Independent has not added any product or service information to TRADERS' RESOURCE. | |
Click here for more information about our publications!
Comments
Date: 03/19/09Rank: 2Comment:

Request Information From Our Sponsors
- StockCharts.com, Inc.
- Candle Patterns
- Candlestick Charting Explained
- Intermarket Technical Analysis
- John Murphy on Chart Analysis
- John Murphy's Chart Pattern Recognition
- John Murphy's Market Message
- MurphyExplainsMarketAnalysis-Intermarket Analysis
- MurphyExplainsMarketAnalysis-Visual Analysis
- StockCharts.com
- Technical Analysis of the Financial Markets
- The Visual Investor
- VectorVest, Inc.
- Executive Premier Workshop
- One-Day Options Course
- OptionsPro
- Retirement Income Workshop
- Sure-Fire Trading Systems (VectorVest, Inc.)
- Trading as a Business Workshop
- VectorVest 7 EOD
- VectorVest 7 RealTime/IntraDay
- VectorVest AutoTester
- VectorVest Educational Services
- VectorVest OnLine
- VectorVest Options Analyzer
- VectorVest ProGraphics v6.0
- VectorVest ProTrader 7
- VectorVest RealTime Derby Tool
- VectorVest Simulator
- VectorVest Variator
- VectorVest Watchdog
