HOT TOPICS LIST
- MACD
- Fibonacci
- RSI
- Gann
- ADXR
- Stochastics
- Volume
- Triangles
- Futures
- Cycles
- Volatility
- ZIGZAG
- MESA
- Retracement
- Aroon
INDICATORS LIST
LIST OF TOPICS
PRINT THIS ARTICLE
by Donald W. Pendergast, Jr.
The S&P building products group has the worst 13-week relative strength vs, the S&P 500. Here's a look at one of the weaker stocks in this group.
Position: Sell
Donald W. Pendergast, Jr.
Donald W. Pendergast is a financial markets consultant who offers specialized services to stock brokers and high net worth individuals who seek a better bottom line for their portfolios.
PRINT THIS ARTICLE
REL. STR COMPARATIVE
MAS Has Weak Relative Strength
03/18/09 08:54:57 AMby Donald W. Pendergast, Jr.
The S&P building products group has the worst 13-week relative strength vs, the S&P 500. Here's a look at one of the weaker stocks in this group.
Position: Sell
| The recent reversal in the broad US indexes has been astounding. The Standard & Poor's 500 turned higher from 665.70 a week and a half ago, rising all the way to 774.00 (intraday high) as of Monday, March 16's trading session. Just about every industry group's component stocks have participated, too, lending a great deal of credibility to this major round of capitulation. However, the S&P 500 is now beginning to approach an area of heavy overhead resistance, and traders wishing to be prepared for a possible short-term reversal might do well to investigate the charts of stocks from the weakest industry groups — the ones that didn't carry all that much higher on the rebound rally. A fundamental and technical look at one such stock is our next task. |

|
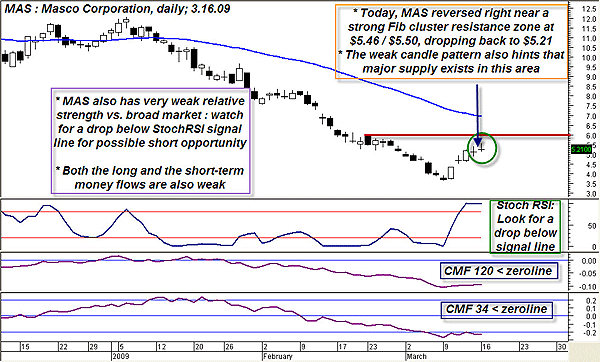
| FIGURE 1: MAS, DAILY. A peaking stochRSI, weak money flows, and heavy overhead resistance all suggest that a move lower may occur soon in this stock. |
| Graphic provided by: MetaStock. |
| |
| Masco Corp. (MAS) is a major supplier of home building/home improvement products such as kitchen cabinets, plumbing fixtures, and other related items. During the great housing boom of 2001–06, the company produced a steady, progressively rising stream of revenue and earnings. Since then, things haven't been going so well, as evidenced by the substantial drop in MAS stock prices. Peaking at $38.43 in early 2005, the stock now trades in the realms of the sub-$5 bargain bin on the NYSE. Currently, the stock has an EPS of -$1.11 annually, and given that it hails from the weakest relative strength industry group, it could be a possible short candidate. At some point, as the housing market makes a final low, this stock could become an outperformer once again, but for now the fundamentals are clearly stacked against this company's stock. |
| Masco's technicals are equally grim, despite the fact that the stock did manage a feeble reversal in concert with the major indexes. The rally in MAS may be running out of steam, however; prices reversed right near a significant multi-Fibonacci resistance zone ($5.46/$5.50) closing at $5.21 today. The pathetic candlestick pattern also provides evidence that MAS has plenty of stock available for sale in the $5.20–5.50 range. Even if it manages to crawl a little higher, there's another strong resistance area near $5.80 (red horizontal line). See Figure 1. Elsewhere on the chart, the stochRSI has peaked even as both measures of Chaikin money flow (the long-term [120-day period]) and short-term (34-day period]) are still mired in bear market territory. Nimble short-sellers might wait for the stochRSI to drop below its upper signal line before attempting a short, and that only if the broad market indexes also pull back in sympathy. In fact, trading such a potential short setup might be safer on a 30- or 60-minute chart; sort of an in-quick, out-quick smash 'n grab kind of trade. The reason is that even if the broad markets pull back a little, the odds are high that they will attempt a retest of Monday's highs sooner rather than later. Retest or not, it's usually best to keep short-sale trades open for a limited time in most cases. |
Donald W. Pendergast is a financial markets consultant who offers specialized services to stock brokers and high net worth individuals who seek a better bottom line for their portfolios.
| Title: | Writer, market consultant |
| Company: | Linear Trading Systems LLC |
| Jacksonville, FL 32217 | |
| Phone # for sales: | 904-239-9564 |
| E-mail address: | lineartradingsys@gmail.com |
Traders' Resource Links | |
| Linear Trading Systems LLC has not added any product or service information to TRADERS' RESOURCE. | |
Click here for more information about our publications!
Comments
Date: 03/19/09Rank: 5Comment:

Request Information From Our Sponsors
- StockCharts.com, Inc.
- Candle Patterns
- Candlestick Charting Explained
- Intermarket Technical Analysis
- John Murphy on Chart Analysis
- John Murphy's Chart Pattern Recognition
- John Murphy's Market Message
- MurphyExplainsMarketAnalysis-Intermarket Analysis
- MurphyExplainsMarketAnalysis-Visual Analysis
- StockCharts.com
- Technical Analysis of the Financial Markets
- The Visual Investor
- VectorVest, Inc.
- Executive Premier Workshop
- One-Day Options Course
- OptionsPro
- Retirement Income Workshop
- Sure-Fire Trading Systems (VectorVest, Inc.)
- Trading as a Business Workshop
- VectorVest 7 EOD
- VectorVest 7 RealTime/IntraDay
- VectorVest AutoTester
- VectorVest Educational Services
- VectorVest OnLine
- VectorVest Options Analyzer
- VectorVest ProGraphics v6.0
- VectorVest ProTrader 7
- VectorVest RealTime Derby Tool
- VectorVest Simulator
- VectorVest Variator
- VectorVest Watchdog
