HOT TOPICS LIST
- MACD
- Fibonacci
- RSI
- Gann
- ADXR
- Stochastics
- Volume
- Triangles
- Futures
- Cycles
- Volatility
- ZIGZAG
- MESA
- Retracement
- Aroon
INDICATORS LIST
LIST OF TOPICS
PRINT THIS ARTICLE
by Paolo Pezzutti
Last week has given hope for a longer rebound. The Elliott wave count indicates that this phase of the bear market may be over.
Position: N/A
Paolo Pezzutti
Author of the book "Trading the US Markets - A Comprehensive Guide to US Markets for International Traders and Investors" - Harriman House (July 2008)
PRINT THIS ARTICLE
TECHNICAL ANALYSIS
Emini S&P Tests November Low
03/18/09 08:25:15 AMby Paolo Pezzutti
Last week has given hope for a longer rebound. The Elliott wave count indicates that this phase of the bear market may be over.
Position: N/A
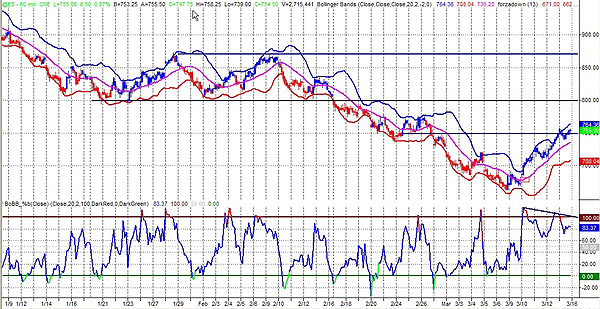
| The emini S&P reached the 750 level from a recent low of 663 in four consecutive up sessions, which we had not seen so many consecutive closes since the end of December last year. It is impressive how prices move directly toward these key points and round numbers. In this time frame, the force index indicator, which I used to indicate the trend, is still up. This indicator takes into account price and volume. A 13-bar exponential moving average (EMA) of the force index is used to track longer-term changes in the force of the market's participants. In the figure you can also see the %b indicator, which is derived from the Bollinger bands. It measures where the last price is in relation to the bands. %b has moved to the overbought level. Now it is printing a negative divergence. Note the March 10th up gap that in my view is a breakaway gap, and it is an indication that a longer rebound had started. Next resistance should be at 780 and then 800; 750, where prices have arrived so far, represents the low printed back in November. It is difficult to say if this level is such a resistance that will push down prices once again. The next key level is 800, which is the lowest level of the trading range that contained prices between mid-January and mid-February. See Figure 1. |

|
| FIGURE 1: ES, 60-MINUTE. The fast move to the upside last week is confronted now with the important resistance at 750. A breakout of this level could bring prices toward 780 to 800. |
| Graphic provided by: TradeStation. |
| |
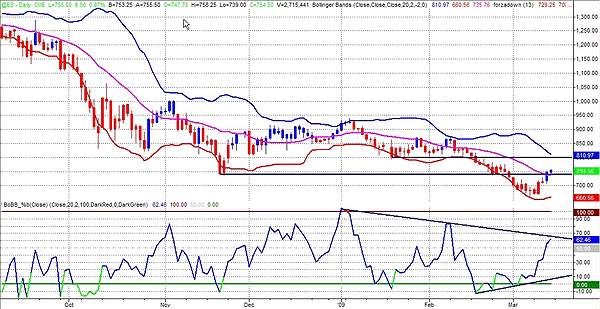
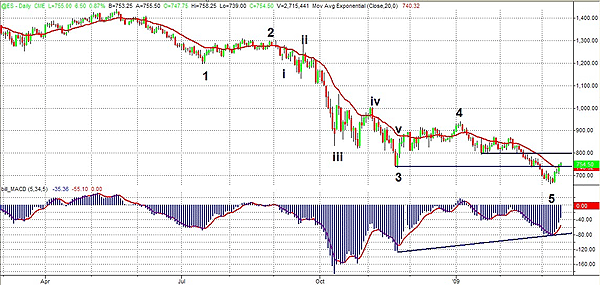
| In the daily time frame, the force index indicator has turned positive and the %b indicator, after printing a positive divergence, is moving higher. You can see that the Bollinger bands are converging, indicating that the impulse to the downside is over so far. What is interesting in this time frame is that the Elliott wave count indicates that a wave 5 has been developed to the downside, printing a new low with respect to the wave 3 low of November 2008 and a positive divergence of the moving average convergence/divergence (MACD). I think this phase of the downtrend is over. The test of the 708–800 area is crucial for the continuation of the rebound and the development of a longer A-B-C corrective wave. If this scenario is correct, we could see again the 900 level in the next months. See Figures 2 and 3. |

|
| FIGURE 2: ES, DAILY. The force indicator has turned positive on Thursday. The %b indicator has printed a positive divergence. |
| Graphic provided by: TradeStation. |
| |
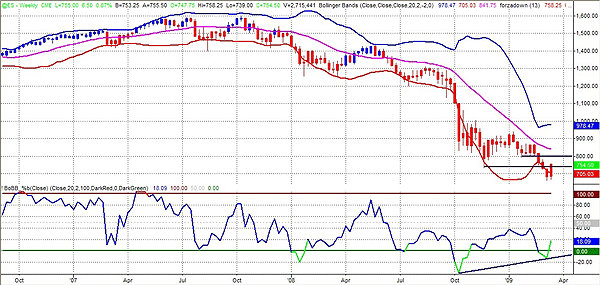
| In the weekly time frame you can see that the force index indicator is still down, while the %b indicator has printed a positive divergence. There is the potential for a significant rebound from here, although there are no practical signals yet. See Figure 4. |

|
| FIGURE 3: ES, DAILY. The Elliott wave count displays that after a five- wave down move, we could see a longer rebound. A fast move to retest the lows could negate this scenario. |
| Graphic provided by: TradeStation. |
| |
| We are still in a downtrend. For the moment, there are no indications of a trend reversal in the longer time frame. However, in the 60-minute time frame the leg printed last week has been pretty interesting looking more an impulse to the upside than a choppy pullback. Unfortunately, this market has already displayed how quickly it can turn to the downside and there are important resistance levels ahead (780 to 800). Given the divergence of the %b indicator, I would wait for pullbacks to enter short-term long positions. This could be done timing shorter time frames should a correction occur in the next days; 740 is a first support and then lower at 720. |

|
| FIGURE 4: ES, WEEKLY. There are no sign of a trend reversal in this time frame. Only the %b indicator is printing a positive divergence. |
| Graphic provided by: TradeStation. |
| |
Author of the book "Trading the US Markets - A Comprehensive Guide to US Markets for International Traders and Investors" - Harriman House (July 2008)
| Address: | VIA ROBERTO AGO 26 POSTAL CODE 00166 |
| Rome, ITALY | |
| Phone # for sales: | +393357540708 |
| E-mail address: | pezzutti.paolo@tiscali.it |
Click here for more information about our publications!
Comments
Date: 03/19/09Rank: 3Comment:

Request Information From Our Sponsors
- VectorVest, Inc.
- Executive Premier Workshop
- One-Day Options Course
- OptionsPro
- Retirement Income Workshop
- Sure-Fire Trading Systems (VectorVest, Inc.)
- Trading as a Business Workshop
- VectorVest 7 EOD
- VectorVest 7 RealTime/IntraDay
- VectorVest AutoTester
- VectorVest Educational Services
- VectorVest OnLine
- VectorVest Options Analyzer
- VectorVest ProGraphics v6.0
- VectorVest ProTrader 7
- VectorVest RealTime Derby Tool
- VectorVest Simulator
- VectorVest Variator
- VectorVest Watchdog
- StockCharts.com, Inc.
- Candle Patterns
- Candlestick Charting Explained
- Intermarket Technical Analysis
- John Murphy on Chart Analysis
- John Murphy's Chart Pattern Recognition
- John Murphy's Market Message
- MurphyExplainsMarketAnalysis-Intermarket Analysis
- MurphyExplainsMarketAnalysis-Visual Analysis
- StockCharts.com
- Technical Analysis of the Financial Markets
- The Visual Investor
