HOT TOPICS LIST
- MACD
- Fibonacci
- RSI
- Gann
- ADXR
- Stochastics
- Volume
- Triangles
- Futures
- Cycles
- Volatility
- ZIGZAG
- MESA
- Retracement
- Aroon
INDICATORS LIST
LIST OF TOPICS
PRINT THIS ARTICLE
by Chaitali Mohile
Will the breakout rally of CIU continue?
Position: N/A
Chaitali Mohile
Active trader in the Indian stock markets since 2003 and a full-time writer. Trading is largely based upon technical analysis.
PRINT THIS ARTICLE
ROUND TOP & BOTTOM
CIU Is Consolidating
03/17/09 11:35:10 AMby Chaitali Mohile
Will the breakout rally of CIU continue?
Position: N/A
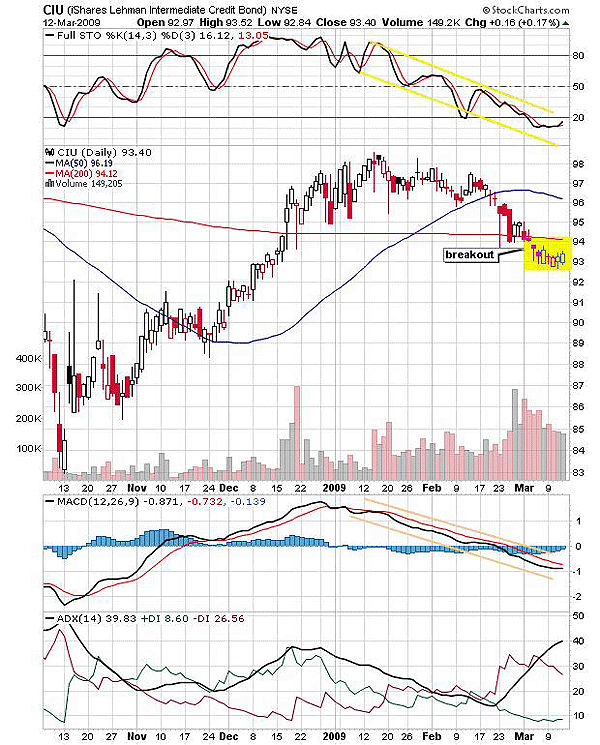
| The 200-day moving average (MA) was a strong support for the iShares Lehman Intermediate Credit Bond (CIU). A rounded-top pattern that was formed with support of the 200-day MA broke down in early March. This pattern is a bearish signal, suggesting a trend reversal. In Figure 1, the average directional movement index (ADX) (14) showed a developing uptrend during the formation of the bearish pattern. As CIU descended from the peak above $98, the uptrend declined as well and gradually entered a weak zone below 20. The breakout of the rounded-top is considered below the MA support. The bearish pattern in Figure 1 violated the 200-day MA support in early March 2009. Note the changed trend in ADX (14). A new downtrend was developed with the robust bearish strength. Thus, the breakout of the rounded top in CIU was confirmed. |

|
| FIGURE 1: CIU, DAILY. The 200-day MA support is converted into the resistance after the rounded-top breakout. |
| Graphic provided by: StockCharts.com. |
| |
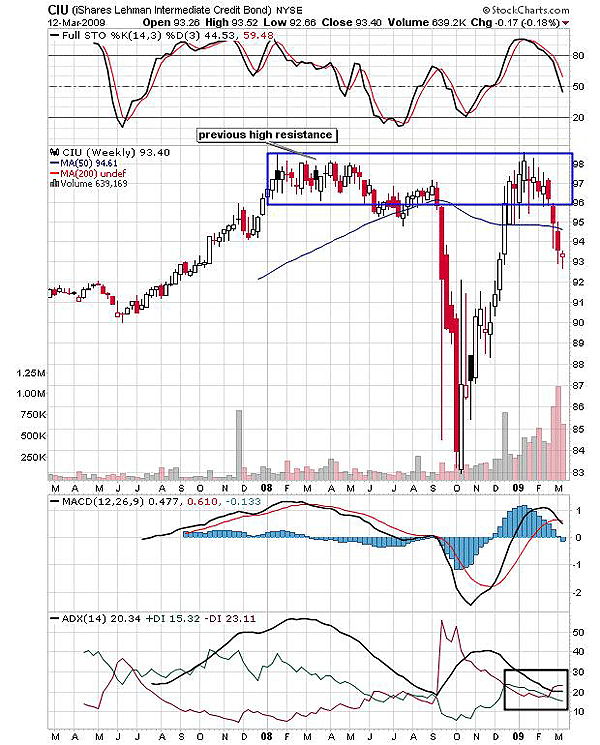
| After the breakout, the stock has been consolidating for two weeks. Undergoing consolidation immediately after the breakout is considered a healthy sign for the breakout rally. But if the consolidation period gets extended for longer periods, then the breakout may fail. So it's high time for CIU to resume the bearish breakout rally. The stochastic (14,3,3) in Figure 2 is oversold, suggesting a minor upside action. The moving average convergence/divergence (MACD) (12,26,9) had slid vertically in negative territory, indicating negative momentum. And the ADX (14) is ready to hit the overheated downtrend. These highly bearish signals indicated an upside swing toward the upper range of the consolidation. Currently, the stock is consolidating in a narrow range of $93 to $94. The pattern would fail if $94 is violated. |

|
| FIGURE 2: CIU, WEEKLY. The rounded top is formed in the strong resistance zone of the previous highs. |
| Graphic provided by: StockCharts.com. |
| |
| In Figure 2, we can see that the round top was formed under the resistance of the previous highs made in 2008. We can see a long volatile consolidation phase in 2008 near $98. This suggests that $98 has been a strong resistance zone even in 2009. As a result, CIU formed the round top in the same resistance area. The breakout of this pattern is reconfirmed as the price has moved below the 50-day moving average (MA). |
| The stochastic (14,3,3) has declined from the overbought levels. The MACD (12,26,9) may turn negative after a bearish crossover. The ADX (14) at 20 is indicating a developing downtrend. Therefore, the bears have a strong hold that can make the breakout rally successful. |
| Hence, the bigger picture suggests the breakout rally of CIU would continue its downside journey after completing the consolidation period. |
Active trader in the Indian stock markets since 2003 and a full-time writer. Trading is largely based upon technical analysis.
| Company: | Independent |
| Address: | C1/3 Parth Indraprasth Towers. Vastrapur |
| Ahmedabad, Guj 380015 | |
| E-mail address: | chaitalimohile@yahoo.co.in |
Traders' Resource Links | |
| Independent has not added any product or service information to TRADERS' RESOURCE. | |
Click here for more information about our publications!
Comments

Request Information From Our Sponsors
- StockCharts.com, Inc.
- Candle Patterns
- Candlestick Charting Explained
- Intermarket Technical Analysis
- John Murphy on Chart Analysis
- John Murphy's Chart Pattern Recognition
- John Murphy's Market Message
- MurphyExplainsMarketAnalysis-Intermarket Analysis
- MurphyExplainsMarketAnalysis-Visual Analysis
- StockCharts.com
- Technical Analysis of the Financial Markets
- The Visual Investor
- VectorVest, Inc.
- Executive Premier Workshop
- One-Day Options Course
- OptionsPro
- Retirement Income Workshop
- Sure-Fire Trading Systems (VectorVest, Inc.)
- Trading as a Business Workshop
- VectorVest 7 EOD
- VectorVest 7 RealTime/IntraDay
- VectorVest AutoTester
- VectorVest Educational Services
- VectorVest OnLine
- VectorVest Options Analyzer
- VectorVest ProGraphics v6.0
- VectorVest ProTrader 7
- VectorVest RealTime Derby Tool
- VectorVest Simulator
- VectorVest Variator
- VectorVest Watchdog
