HOT TOPICS LIST
- MACD
- Fibonacci
- RSI
- Gann
- ADXR
- Stochastics
- Volume
- Triangles
- Futures
- Cycles
- Volatility
- ZIGZAG
- MESA
- Retracement
- Aroon
INDICATORS LIST
LIST OF TOPICS
PRINT THIS ARTICLE
by Donald W. Pendergast, Jr.
The bear market reversal in the S&P 500 appears to have some staying power. More than 40% of this index's component stocks flashed a buy signal over the past two sessions.
Position: Accumulate
Donald W. Pendergast, Jr.
Donald W. Pendergast is a financial markets consultant who offers specialized services to stock brokers and high net worth individuals who seek a better bottom line for their portfolios.
PRINT THIS ARTICLE
REVERSAL
Capitulation Confirmed With Massive Wave Of S&P 500 Component Buy Signals
03/16/09 01:16:00 PMby Donald W. Pendergast, Jr.
The bear market reversal in the S&P 500 appears to have some staying power. More than 40% of this index's component stocks flashed a buy signal over the past two sessions.
Position: Accumulate
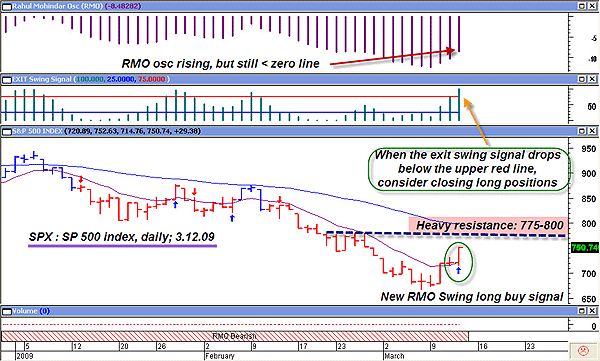
| Anybody watching the intraday price action in the S&P 500 over the last three sessions would likely agree -- this is a major round of capitulation, with stocks from every significant industry group participating. The index has risen by 12.59% in less than a week on ultra-high volume and market breadth, helping to persuade even the most hardened bears that this is more than a flash in the pan rally. The index is still in a bear market, however, and even this rally will face major overhead resistance challenges fairly soon. The S&P 500 daily chart in Figure 1 paints an interesting, yet mixed technical picture for traders and investors. |

|
| FIGURE 1: SPX, DAILY. A strong reversal higher, but this index will soon face substantial overhead resistance near 775–800. |
| Graphic provided by: MetaStock. |
| Graphic provided by: Rahul Mohindar indicators from MetaStock v 10.1. |
| |
| The index has finally cleared its 20-day exponential moving average (EMA) for the first time in a month, and today's wide-range bar seems to imply that the index has its sights set on a runup toward the next set of resistance areas between 775 and 800 (pink shaded rectangle). The Rahul Mohindar oscillator (RMO) at the top of the chart shows strong upward momentum, but it's still shy of being in a bullish phase. Meanwhile, the exit swing signal (middle pane) is well above its upper boundary, and a drop below it will indicate that longs should either close their positions and/or take partial profits and trail a closer stop. So while the reversal off of the lows is encouraging, wise traders and investors will only want to deploy capital into the strongest stocks with the highest relative strength versus the S&P 500. Now, let's see which S&P 500 component stocks might qualify for a long entry right now -- stocks also firing a long RMO swing trade signal with a very high relative strength versus the S&P 500. |

|
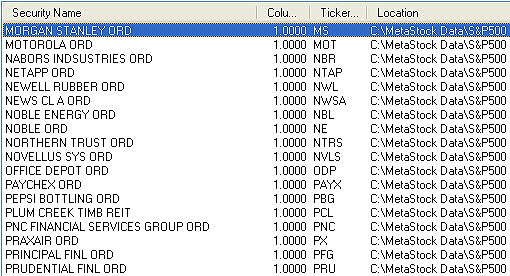
| FIGURE 2: S&P 500 COMPONENTS (SOME OF THEM, AT LEAST). While more than 100 S&P 500 component stocks fired a buy signal today, only one of them had the highest 13-week relative strength versus the S&P 500: Morgan Stanley. |
| Graphic provided by: MetaStock. |
| |
| Running the RMO swing trade buy signal exploration in MetaStock over the last two sessions produced an incredible number of buy signals -- 218 of them! Compared to the last major reversal off a bear market low (November 21 and 24, 2008), this current rally has produced more than twice the number of buy signals, lending extra credibility to the power of this major reversal episode in the broad markets. On the MetaStock exploration output page (see Figure 2), part of the buy signal output is shown; I've highlighted Morgan Stanley (MS) because it's the stock with a long buy signal that also boasts the highest 13-week relative strength versus the S&P 500. All else being equal, a trader looking to deploy cash into a long buy setup would probably want to stay with the stronger relative strength stocks. |

|
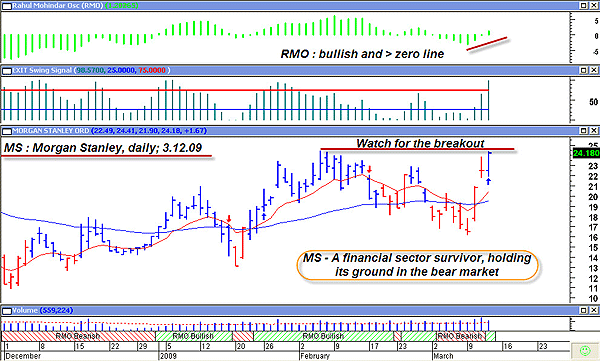
| FIGURE 3: MS, DAILY. A fresh RMO swing buy signal, one occurring near a potential breakout level. For a financial sector stock, MS has performed remarkably well in the past few months. |
| Graphic provided by: MetaStock. |
| Graphic provided by: Rahul Mohindar indicators from MetaStock v 10.1. |
| |
| Morgan Stanley's performance since November 2008 is pretty impressive, given that it hails from such a troubled industry group (Figure 3). Stocks with high 13-week relative strength tend to outperform for a time, so it's possible that a major breakout may be in the works for this brokerage giant. Short-term traders might want to drop down to a 30- or 60-minute chart to play any retracement move on a pullback of the pullback from the overhead resistance; it could be worth a few points, and in a hurry. But given the RMO daily signal, strong S&P 500 price momentum and MS's high relative strength, selling an April $25 covered call might be an attractive play. The calls are going for almost $2.85, reducing a long purchase price of 100 shares by $285. If the stock closes below $20.75, effectively filling the gap on the chart, consider closing the trade early for a modest loss. If the stock performs well, getting called away at an April option expiration, the trade will return approximately 115% on an annualized basis. |
| Staying with the strongest stocks will generally lead to more favorable outcomes for those trading from the long side, regardless of the style of trading you prefer. Spend some time researching the relative strength readings and see if it doesn't improve your trading results. |
Donald W. Pendergast is a financial markets consultant who offers specialized services to stock brokers and high net worth individuals who seek a better bottom line for their portfolios.
| Title: | Writer, market consultant |
| Company: | Linear Trading Systems LLC |
| Jacksonville, FL 32217 | |
| Phone # for sales: | 904-239-9564 |
| E-mail address: | lineartradingsys@gmail.com |
Traders' Resource Links | |
| Linear Trading Systems LLC has not added any product or service information to TRADERS' RESOURCE. | |
Click here for more information about our publications!
Comments
Date: 03/17/09Rank: 4Comment:

Request Information From Our Sponsors
- StockCharts.com, Inc.
- Candle Patterns
- Candlestick Charting Explained
- Intermarket Technical Analysis
- John Murphy on Chart Analysis
- John Murphy's Chart Pattern Recognition
- John Murphy's Market Message
- MurphyExplainsMarketAnalysis-Intermarket Analysis
- MurphyExplainsMarketAnalysis-Visual Analysis
- StockCharts.com
- Technical Analysis of the Financial Markets
- The Visual Investor
- VectorVest, Inc.
- Executive Premier Workshop
- One-Day Options Course
- OptionsPro
- Retirement Income Workshop
- Sure-Fire Trading Systems (VectorVest, Inc.)
- Trading as a Business Workshop
- VectorVest 7 EOD
- VectorVest 7 RealTime/IntraDay
- VectorVest AutoTester
- VectorVest Educational Services
- VectorVest OnLine
- VectorVest Options Analyzer
- VectorVest ProGraphics v6.0
- VectorVest ProTrader 7
- VectorVest RealTime Derby Tool
- VectorVest Simulator
- VectorVest Variator
- VectorVest Watchdog
