HOT TOPICS LIST
- MACD
- Fibonacci
- RSI
- Gann
- ADXR
- Stochastics
- Volume
- Triangles
- Futures
- Cycles
- Volatility
- ZIGZAG
- MESA
- Retracement
- Aroon
INDICATORS LIST
LIST OF TOPICS
PRINT THIS ARTICLE
by Ron Walker
Is the market now breaking ranks with the bears? Recoveries are usually multifaceted, integrating candlestick reversal patterns, trend changes, chart patterns, indicators, moving averages, and divergences. If this is a legitimate turnaround, we should see evidence of it in several different areas of technical analysis, as indicators and price complement each other in an orderly reversal.
Position: N/A
Ron Walker
Ron Walker is an active trader and technical analyst. He operates an educational website dedicated to the study of Technical Analysis. The website offers free market analysis with daily video presentations and written commentaries. Ron is a video pioneer, being one of the first to utilize the internet producing Technical Analysis videos. His website is thechartpatterntrader.com
PRINT THIS ARTICLE
TECHNICAL ANALYSIS
Breaking Ranks With The Bears
03/16/09 12:18:27 PMby Ron Walker
Is the market now breaking ranks with the bears? Recoveries are usually multifaceted, integrating candlestick reversal patterns, trend changes, chart patterns, indicators, moving averages, and divergences. If this is a legitimate turnaround, we should see evidence of it in several different areas of technical analysis, as indicators and price complement each other in an orderly reversal.
Position: N/A
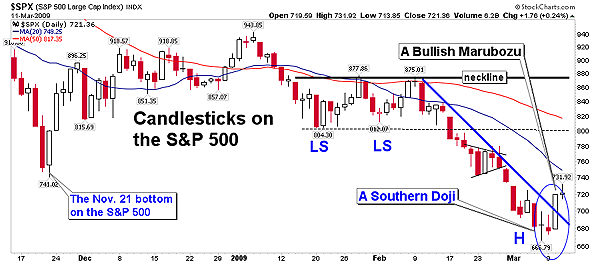
| After undergoing ever-increasing volatility in price, the Standard & Poor's 500 currently looks to be sheltered from further price erosion. Piercing through its minor downward trendline has made it more resilient, and apparently, a youthful rally has begun. Figure 1 shows that the S&P 500 began to sharply decline during February, falling more than 200 points from its peak of 875 in mid-February to a momentum low of 666 by early March. By early March the bears had left the S&P 500 in shambles, trampling the index down by approximately 24% in four weeks. The bulls might be finally ready to wage war on the bears and reclaim some lost ground. |

|
| FIGURE 1: SPX, DAILY. Here we see that the southern doji of indecision put in the momentum low at 666. Followed by by an inverted hammer, another reversal pattern. Both candlesticks were confirmed as a bullish marubozu broke the minor downtrend. If prices rise above the 800 level of resistance they may continue a charge toward 875, completing a speculative head of an inverse head & shoulders pattern. |
| Graphic provided by: StockCharts.com. |
| |
| In Figure 1, we see that on March 6, a doji candlestick appeared on the S&P 500 daily chart (representing indecision), which was followed by an inverted hammer (a bullish reversal pattern). On March 10, the following trading session, the bulls were in full swing when an extremely long white marubozu candlestick materialized. The bulls announced their arrival very boldly, as they penetrated through the minor decelerating trendline. Now, if price rallies to new highs and then a higher low appears, the downtrend will have concluded for the time being. The marubozu candle has a long white body with no shadow on either end, and it is a cousin to the bullish belt hold candlestick, a prominent reversal pattern. The marubozu confirmed the inverted hammer candlestick by closing above its highest peak, temporarily marking the doji as a minor bottom. When a doji marks a bottom it is referred to as a southern doji, and when it forms at the peak of a trend, it is called a northern doji. |

|
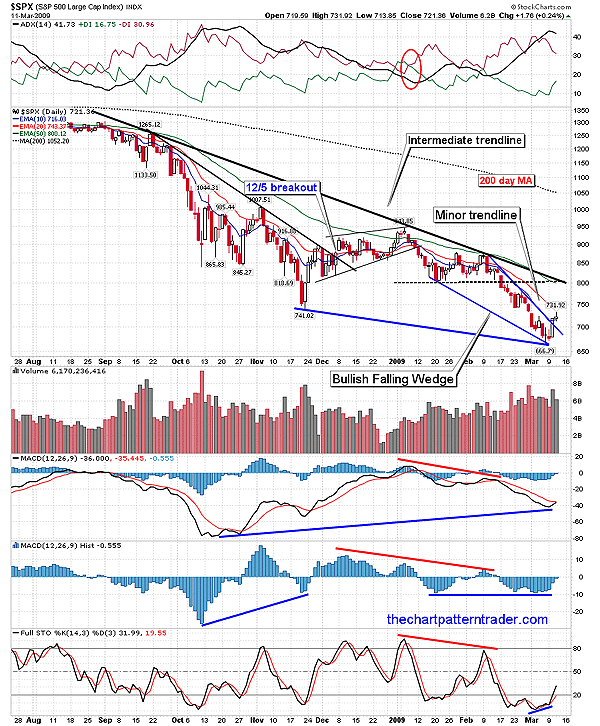
| FIGURE 2: SPX, DAILY. The breakout of the bullish falling wedge busted through the minor trendline, rendering it harmless. Should the MACD get an assured bullish cross, the price will rise to challenge the intermediate trendline. The large divergence on the MACD should bolster the bulls. |
| Graphic provided by: StockCharts.com. |
| |
| In Figure 2, we can see that the intermediate declining trendline that began in September 2008 almost intersects with horizontal resistance near 800. This area will be a major road block to the index, because it is where the 50-day exponential moving average (EMA) resides, and it will take some maneuvering in order for this trendline to break. Should the index break above the intermediate trendline it will do so at the 875 level, which could establish the neckline for a complex inverse head & shoulders pattern. A push at/near the 875 level would complete the head, with two left shoulders having already been completed. There are certain bullish forces at work that may spark this rally to much-higher levels, near the intermediate trendline near 800. If the S&P 500 breaks the intermediate downtrend it will be granted the right of passage, clearing the way to test key overhead resistance at 875. |
| While the S&P 500 was busy turning in the opposite direction of the bearish trend and breaking out of a bullish falling wedge pattern, the moving average convergence/divergence (MACD) (12, 26, 9) began recycling up toward its signal line, creating a divergence with the price chart (Figure 2). The price target for any falling wedge is always the highest peak in the pattern, which would put the price objective at the February high of 875. The MACD line is coming into close contact with its signal line as the indicator sets up a bullish realignment. The bullish divergence should push the MACD line over the top penetrating the signal line. The MACD histogram (12, 26, 9) also has a divergence with the lower boundary of the bullish falling wedge. Prices made lower lows while the histogram put in a double bottom, making an equivalent momentum low in January. The histogram may be the bellwether of bullish indicators, now that it has a rising slope that is making its way toward the zero line. The next histogram tower should soar above the last histogram peak, breaking the declining trend on the indicator from the previous months. In addition, the average directional movement index (ADX) (14) peaked above 40 and is now tipping lower (Figure 2), indicating less volatility in the days ahead, suggesting that the current trend is losing strength. Meanwhile, the negative directional index (-DI) has sharply fallen, further weakening the bearish momentum. The +DI and -DI are moving closer together, which should bolster the bulls, allowing the rally to flourish. The stochastic (14, 3, 3) is beginning to awaken as it rises out of oversold territory, the price reversal bolstering the stochastic line and causing it to stand on end and stiffen up. |

|
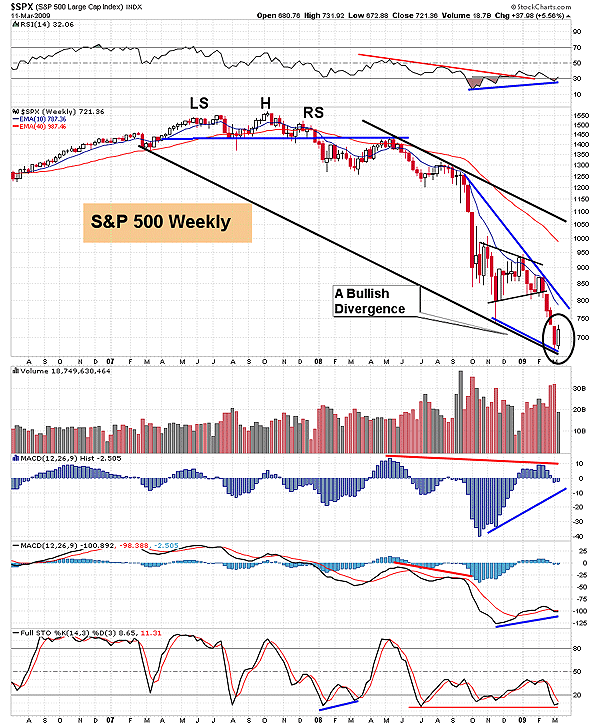
| FIGURE 3: SPX, WEEKLY. While the intermediate and the minor trendless are visible on the daily chart, we need the weekly to see the primary trendline, which is the upper boundary of this falling channel. Look for the MACD histogram to put in rising bars for positive divergence to be completed. Note the classic bullish piercing line, which is a two-week reversal candle pattern. However, the weekly chart's final print hasn't yet occurred for the week. |
| Graphic provided by: StockCharts.com. |
| |
| Figure 3 illustrates the weekly chart of the S&P 500, which makes a compelling case that the tide is turning. A large divergence has formed between price and the relative strength index (RSI) (14), along with the MACD histogram (12, 26, 9). Once the bars on the MACD histogram move back above the zero line, momentum should pick up, allowing the MACD to complete its divergence resulting in a fresh bullish cross. Note how the divergence formed in the lower part of the gigantic falling channel. The stochastic (14, 3, 3) line is most effective at catching momentum when it begins to hook up on the weekly chart. If the stochastic turns bullish while the histogram moves back into positive territory, then the momentum indicators are in agreement. This should cause the bulls to snap up positions, creating demand. As I write this, a bullish piercing line two-week candle pattern has formed on the weekly chart at the bottom of the falling price channel. This first week of the pattern has a long red body, which is followed by a long white body that at first opens below the low of the previous week but then closes the week out within and above the midpoint of the first week's candle. However, this pattern on the weekly chart is subject to change because the final print on the weekly chart won't occur until the market closes on Friday. So the overall conditions for the short-term look favorable, but you can be sure that the bears will be looking over our shoulders at every point of resistance. |
Ron Walker is an active trader and technical analyst. He operates an educational website dedicated to the study of Technical Analysis. The website offers free market analysis with daily video presentations and written commentaries. Ron is a video pioneer, being one of the first to utilize the internet producing Technical Analysis videos. His website is thechartpatterntrader.com
| Website: | thechartpatterntrader.com |
| E-mail address: | thechartpatterntrader@gmail.com |
Click here for more information about our publications!
PRINT THIS ARTICLE

Request Information From Our Sponsors
- VectorVest, Inc.
- Executive Premier Workshop
- One-Day Options Course
- OptionsPro
- Retirement Income Workshop
- Sure-Fire Trading Systems (VectorVest, Inc.)
- Trading as a Business Workshop
- VectorVest 7 EOD
- VectorVest 7 RealTime/IntraDay
- VectorVest AutoTester
- VectorVest Educational Services
- VectorVest OnLine
- VectorVest Options Analyzer
- VectorVest ProGraphics v6.0
- VectorVest ProTrader 7
- VectorVest RealTime Derby Tool
- VectorVest Simulator
- VectorVest Variator
- VectorVest Watchdog
- StockCharts.com, Inc.
- Candle Patterns
- Candlestick Charting Explained
- Intermarket Technical Analysis
- John Murphy on Chart Analysis
- John Murphy's Chart Pattern Recognition
- John Murphy's Market Message
- MurphyExplainsMarketAnalysis-Intermarket Analysis
- MurphyExplainsMarketAnalysis-Visual Analysis
- StockCharts.com
- Technical Analysis of the Financial Markets
- The Visual Investor
