HOT TOPICS LIST
- MACD
- Fibonacci
- RSI
- Gann
- ADXR
- Stochastics
- Volume
- Triangles
- Futures
- Cycles
- Volatility
- ZIGZAG
- MESA
- Retracement
- Aroon
INDICATORS LIST
LIST OF TOPICS
PRINT THIS ARTICLE
by James Kupfer
Continuing an exploration of the similarities between today's market environment and the Great Depression leads to a price target for this move up.
Position: Accumulate
James Kupfer
Mr. Kupfer is a market professional and amateur stock market commentator. Disclosure: It is likely that Mr. Kupfer has or will enter a position in any security he writes about.
PRINT THIS ARTICLE
CYCLES
DJ Vu: Where Is the Next Top?
03/12/09 08:52:06 AMby James Kupfer
Continuing an exploration of the similarities between today's market environment and the Great Depression leads to a price target for this move up.
Position: Accumulate
| In the previous parts of my "DJ Vu" articles, I have explored some of the similarities between the fall of the stock market in the 1930s and from 2007 onward. As I mentioned before, there are more similarities that have yet to be expounded upon (by me, at least) that further tie these two seemingly disparate time frames together structurally. |
| But first, let me review the performance of the previous market call I made in "DJ Vu, Part II." In that article I stated, "The Dow Jones would be expected to bottom on an intermediate-term basis in the next week [the week of March 9] around 6247." In fact, the market seems to have bottomed that previous Thursday at 6469. The level of 6430 was a level that I have previously tied to two important Fibonacci support zones for the market, so this was not entirely unexpected. Therefore, the average period of decline is an identical 13 weeks during the 1930s and today, and the move down was very near to its target. |
| Now that a new up leg has begun in the market, there is a very strong historical connection that can be made to the price action of today versus what occurred in the 1930s that may help identify a price target for this move. As you may know, the bear market of the Great Depression occurred in seven major moves down. Since the seventh move was the market bottom, we will ignore that for now. Of the six legs down, the first retraced between 50% and 61.8% of its move down before topping out and starting back down. The remaining five all retraced between 38.2% and 50% of the move down before topping and starting back down. |
| Fast forward to today. The market has had four main legs down since November 2007. The first one, from November 2007 to January 2008, retraced between 50% and 61.8% of the move down before topping out and starting leg 2 down. Legs 2 and 3 both retraced between 38.2% and 50% of the move down before topping out and starting a new leg down. As you can see, the cyclical structure of what has happened in the last two years with retracement moves is so far absolutely identical to what happened in 1929–32. |

|
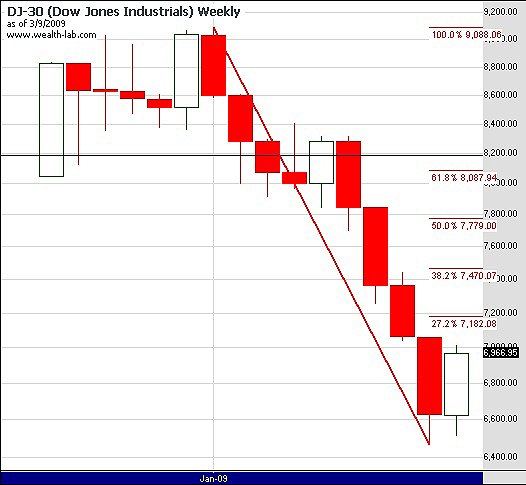
| FIGURE 1: DJIA. Assuming last week was a significant bottom, the Dow Jones Industrial Average should rebound to between the 38.2% and 50% Fibonacci retracement levels. |
| Graphic provided by: Wealth-Lab. |
| |
| Again using the Great Depression bear market as a guide, we would expect that this new upswing in the market would reach its zenith with a retracement of between 38.2% and 50% of the recent leg down. Therefore, the Dow Jones Industrial Average (DJIA) should reach a minimum level of 7470 and a maximum level of 7779 before starting a new leg down that will bring us to fresh lows. |
Mr. Kupfer is a market professional and amateur stock market commentator. Disclosure: It is likely that Mr. Kupfer has or will enter a position in any security he writes about.
Click here for more information about our publications!
PRINT THIS ARTICLE

Request Information From Our Sponsors
- StockCharts.com, Inc.
- Candle Patterns
- Candlestick Charting Explained
- Intermarket Technical Analysis
- John Murphy on Chart Analysis
- John Murphy's Chart Pattern Recognition
- John Murphy's Market Message
- MurphyExplainsMarketAnalysis-Intermarket Analysis
- MurphyExplainsMarketAnalysis-Visual Analysis
- StockCharts.com
- Technical Analysis of the Financial Markets
- The Visual Investor
- VectorVest, Inc.
- Executive Premier Workshop
- One-Day Options Course
- OptionsPro
- Retirement Income Workshop
- Sure-Fire Trading Systems (VectorVest, Inc.)
- Trading as a Business Workshop
- VectorVest 7 EOD
- VectorVest 7 RealTime/IntraDay
- VectorVest AutoTester
- VectorVest Educational Services
- VectorVest OnLine
- VectorVest Options Analyzer
- VectorVest ProGraphics v6.0
- VectorVest ProTrader 7
- VectorVest RealTime Derby Tool
- VectorVest Simulator
- VectorVest Variator
- VectorVest Watchdog
