HOT TOPICS LIST
- MACD
- Fibonacci
- RSI
- Gann
- ADXR
- Stochastics
- Volume
- Triangles
- Futures
- Cycles
- Volatility
- ZIGZAG
- MESA
- Retracement
- Aroon
INDICATORS LIST
LIST OF TOPICS
PRINT THIS ARTICLE
by James Kupfer
History may be happening again in more ways than one.
Position: Accumulate
James Kupfer
Mr. Kupfer is a market professional and amateur stock market commentator. Disclosure: It is likely that Mr. Kupfer has or will enter a position in any security he writes about.
PRINT THIS ARTICLE
CYCLES
DJ Vu, Part II
03/11/09 08:48:31 AMby James Kupfer
History may be happening again in more ways than one.
Position: Accumulate
| On February 18, I wrote in an article entitled "DJ Vu" about some of the apparent cyclical relationships between the current bear market and that of the early 1930s. After writing that article, I decided to see if there were any other apparent relationships that might be of interest. There are. |

|
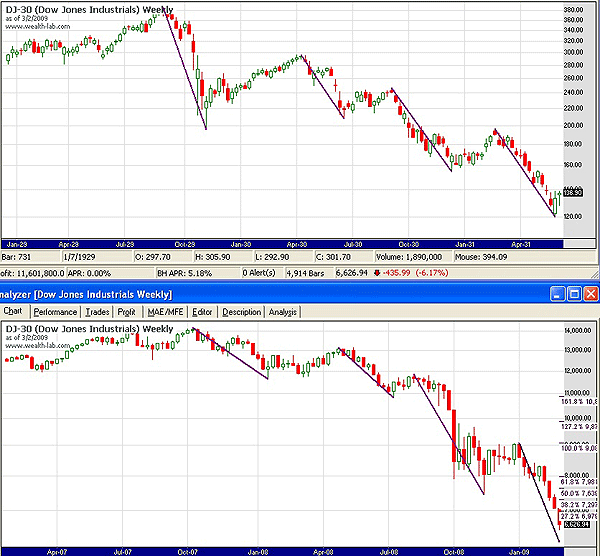
| FIGURE 1: DJIA, WEEKLY. Although the moves vary in magnitude, there is a strong similarity between the price action in the 1930s and today. |
| Graphic provided by: Wealth-Lab. |
| |
| There have thus far been four major down moves from the market top in 2007. These are labeled on the bottom chart. The bear market of the early 1930s consisted of seven major down moves, of which I have shown the first four for comparison. There are more comparisons that may come into play in the future, but for now let us focus upon two relevant comparisons between these bear market moves. See Figure 1. |
| During the Great Depression, move 1 lasted 11 weeks as did move 2, while moves 3 and 4 were both 15 weeks in length, for an average of 13 weeks per move. In the recent bear market, move 1 lasted 16 weeks, move 2 lasted 12 weeks, and move 3 was 15 weeks, while the current move 4 down has currently lasted nine weeks. Should move 4 end this week (week 10), the average length for each move down would be 13.25 weeks. While this is not a very large sample group, it is apparent that there are great similarities between the lengths of time that each move has taken. If the similarities hold, we should expect the current move to end this week. |
| Fibonacci ratios were good predictors of future price action during the bear market of the Great Depression. The bottom of move 3 was near 161.8% of move 2, while the bottom of move 4 was near 127.2% of move 3. Similarly, the bottom of the 2008 move 3 was near 200% of move 2, while move 4 is approaching 127.2% of move 3. That price target would be 6247. However, as I stated on February 20, there are two other Fibonacci support levels right around 6430. |
| In summary, there are interesting similarities between the downward moves of the 1930s and today. These include the time duration of the moves as well as the Fibonacci relationships between the moves. This coupled with the price action previously described in "DJ Vu" lends further credence to the idea that what is happening now is similar in structure to what happened in the 1930s, and as such can serve as a guidepost as to what may come. Should these relationships continue to hold, the Dow Jones 30 would be expected to bottom on an intermediate-term basis in the next week around 6247. |
Mr. Kupfer is a market professional and amateur stock market commentator. Disclosure: It is likely that Mr. Kupfer has or will enter a position in any security he writes about.
Click here for more information about our publications!
PRINT THIS ARTICLE

Request Information From Our Sponsors
- StockCharts.com, Inc.
- Candle Patterns
- Candlestick Charting Explained
- Intermarket Technical Analysis
- John Murphy on Chart Analysis
- John Murphy's Chart Pattern Recognition
- John Murphy's Market Message
- MurphyExplainsMarketAnalysis-Intermarket Analysis
- MurphyExplainsMarketAnalysis-Visual Analysis
- StockCharts.com
- Technical Analysis of the Financial Markets
- The Visual Investor
- VectorVest, Inc.
- Executive Premier Workshop
- One-Day Options Course
- OptionsPro
- Retirement Income Workshop
- Sure-Fire Trading Systems (VectorVest, Inc.)
- Trading as a Business Workshop
- VectorVest 7 EOD
- VectorVest 7 RealTime/IntraDay
- VectorVest AutoTester
- VectorVest Educational Services
- VectorVest OnLine
- VectorVest Options Analyzer
- VectorVest ProGraphics v6.0
- VectorVest ProTrader 7
- VectorVest RealTime Derby Tool
- VectorVest Simulator
- VectorVest Variator
- VectorVest Watchdog
