HOT TOPICS LIST
- MACD
- Fibonacci
- RSI
- Gann
- ADXR
- Stochastics
- Volume
- Triangles
- Futures
- Cycles
- Volatility
- ZIGZAG
- MESA
- Retracement
- Aroon
INDICATORS LIST
LIST OF TOPICS
PRINT THIS ARTICLE
by Chaitali Mohile
ABM Industries has spurred bullish reversal formations on different time frames. Are news-influenced breakouts reliable?
Position: N/A
Chaitali Mohile
Active trader in the Indian stock markets since 2003 and a full-time writer. Trading is largely based upon technical analysis.
PRINT THIS ARTICLE
REVERSAL
ABM Industries Breakout
03/11/09 09:53:47 AMby Chaitali Mohile
ABM Industries has spurred bullish reversal formations on different time frames. Are news-influenced breakouts reliable?
Position: N/A
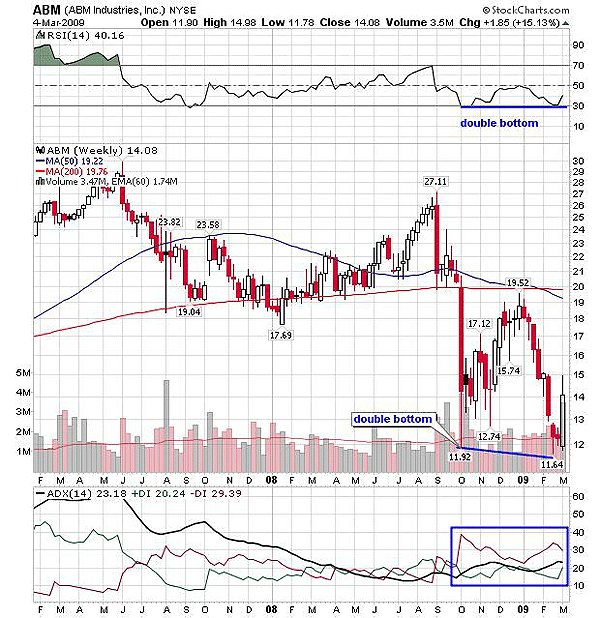
| ABM Industries (ABM) was among the top-gainer stocks on March 3. The stock was up almost 22% because first-quarter results declared on March 2 were much better than market expectations. On technical terms, ABM had formed a double bottom at $11.64 and $11.92 on the weekly time frame in Figure 1. The double bottom is a bullish reversal pattern with an upward breakout. The first low was formed in October 2008 and the second in February 2009. The relative strength index (RSI) (14) in Figure 1 formed the double bottom as well. Therefore, ABM was ready for a bullish breakout. The encouraging financial results added positive momentum that ultimately gave a robust breakout. ABM rallied nearly $4 in one single trading session. The high volume during the breakout indicated traders' interest. However, there might still be many traders waiting to board the rally. |

|
| FIGURE 1: ABM, WEEKLY. The RSI (14) and the price formed the double-bottom pattern. |
| Graphic provided by: StockCharts.com. |
| |
| Trading such sudden breakouts is very tricky. In this situation, the price movement after the breakout should be observed very carefully. The stock either consolidates or retraces back to the previous support. The stock becomes tradeable only if it resumes its breakout rally after completing these reaction moves. In Figure 1, the positive and the negative directional index (+DI) (-DI) of the average directional movement index (ADX) (14) are moving with equal pace, indicating the possibility of consolidation. But since the ADX (14) is currently at 23 and the declining -DI is above the ADX line, we can anticipate that the downtrend is weak. Due to the sudden price breakout, the buying pressure indicated by +DI has increased. Under such conditions, ABM is likely to consolidate. |
| In Figure 1, we can see that the stock failed to surge above the weekly high. Therefore, if ABM consolidates in the range of $15 to $14, the stock can be bought after the bullish breakout. Due to the high volatility across the financial markets, technical conditions should be reviewed before initiating the trade. |

|
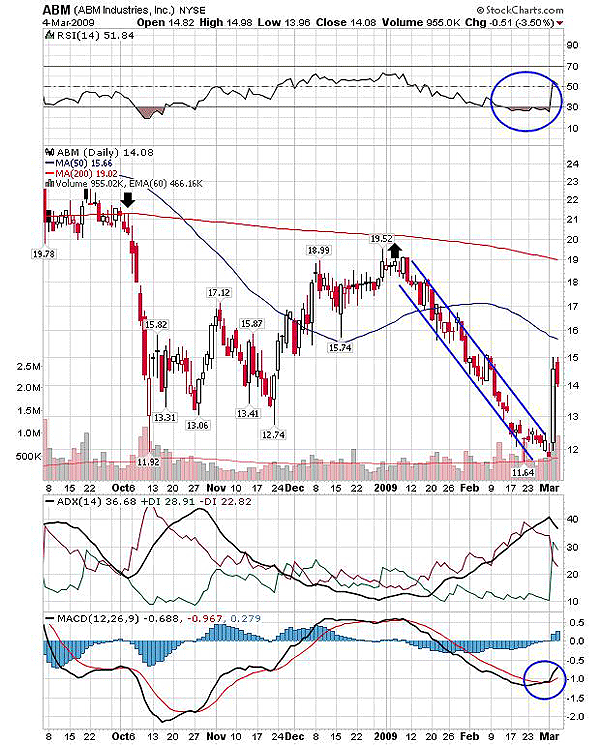
| FIGURE 2: ABM, DAILY. The falling wedge upward breakout was well supported by an oversold RSI(14) and the overheated downtrend. |
| Graphic provided by: StockCharts.com. |
| |
| According to Figure 2, ABM plunged to $12 under strong resistance of the 200-day moving average (MA). The stock formed a steep downward channel, which looks like a falling wedge. The volume declined as the price rushed lower and lower. The RSI (14) turned oversold by moving marginally below the 30 level and the ADX (14) reached the overheated downtrend level above 40. This scenario indicated the bullish breakout. |
| Price spurted after the news and ABM gained nearly 22% in one trading session. The highly bearish conditions in Figure 2 changed dramatically. The oversold RSI (14) surged above 50 levels and the +DI of the ADX (14) rose vertically, indicating a sudden increase in the buying pressure. In addition, the moving average convergence/divergence (MACD) (12,26,9) is likely to turn positive after a bullish crossover. Putting everything together, the breakout rally is likely to undergo the bullish consolidation. The declining 50-day MA resistance is another reason for the sideways move. Therefore, traders can enter the long positions as price moves upward above $15. |
Active trader in the Indian stock markets since 2003 and a full-time writer. Trading is largely based upon technical analysis.
| Company: | Independent |
| Address: | C1/3 Parth Indraprasth Towers. Vastrapur |
| Ahmedabad, Guj 380015 | |
| E-mail address: | chaitalimohile@yahoo.co.in |
Traders' Resource Links | |
| Independent has not added any product or service information to TRADERS' RESOURCE. | |
Click here for more information about our publications!
PRINT THIS ARTICLE

Request Information From Our Sponsors
- StockCharts.com, Inc.
- Candle Patterns
- Candlestick Charting Explained
- Intermarket Technical Analysis
- John Murphy on Chart Analysis
- John Murphy's Chart Pattern Recognition
- John Murphy's Market Message
- MurphyExplainsMarketAnalysis-Intermarket Analysis
- MurphyExplainsMarketAnalysis-Visual Analysis
- StockCharts.com
- Technical Analysis of the Financial Markets
- The Visual Investor
- VectorVest, Inc.
- Executive Premier Workshop
- One-Day Options Course
- OptionsPro
- Retirement Income Workshop
- Sure-Fire Trading Systems (VectorVest, Inc.)
- Trading as a Business Workshop
- VectorVest 7 EOD
- VectorVest 7 RealTime/IntraDay
- VectorVest AutoTester
- VectorVest Educational Services
- VectorVest OnLine
- VectorVest Options Analyzer
- VectorVest ProGraphics v6.0
- VectorVest ProTrader 7
- VectorVest RealTime Derby Tool
- VectorVest Simulator
- VectorVest Variator
- VectorVest Watchdog
