HOT TOPICS LIST
- MACD
- Fibonacci
- RSI
- Gann
- ADXR
- Stochastics
- Volume
- Triangles
- Futures
- Cycles
- Volatility
- ZIGZAG
- MESA
- Retracement
- Aroon
INDICATORS LIST
LIST OF TOPICS
PRINT THIS ARTICLE
by Ron Walker
The next rally in the retail HOLDRS may have been signaled when prices crash-landed into the support made last November. If this level of support continues to hold, RTH may begin a run back to its key level of resistance at $79. The retailers continue to remain range-bound between $60 and $79, and the bulls and bears have clearly drawn the lines of support and resistance.
Position: N/A
Ron Walker
Ron Walker is an active trader and technical analyst. He operates an educational website dedicated to the study of Technical Analysis. The website offers free market analysis with daily video presentations and written commentaries. Ron is a video pioneer, being one of the first to utilize the internet producing Technical Analysis videos. His website is thechartpatterntrader.com
PRINT THIS ARTICLE
SUPPORT & RESISTANCE
Retail HOLDRS Range-Bound
03/10/09 09:11:56 AMby Ron Walker
The next rally in the retail HOLDRS may have been signaled when prices crash-landed into the support made last November. If this level of support continues to hold, RTH may begin a run back to its key level of resistance at $79. The retailers continue to remain range-bound between $60 and $79, and the bulls and bears have clearly drawn the lines of support and resistance.
Position: N/A
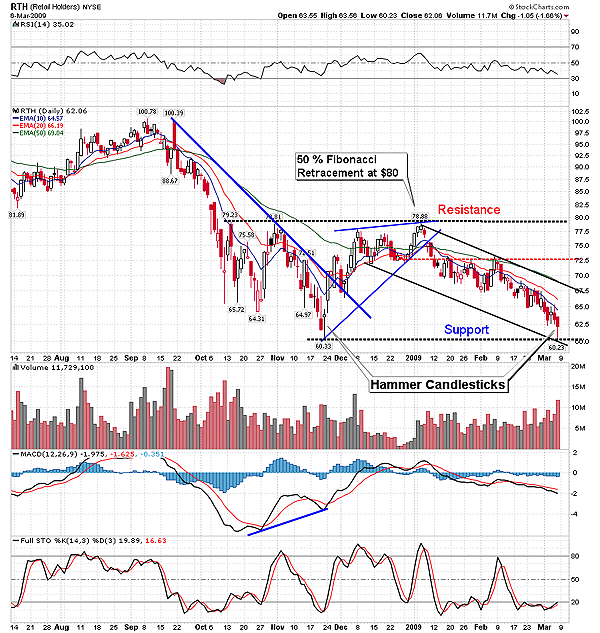
| The retail HOLDRS (RTH) plummeted from its peak at $100 in September 2008 and fell all the way to $60 by late November, losing approximately 40% of its value from the September high (Figure 1). RTH has been clearly marching in sync with the mood of the market. After the bears sliced RTH down to size, a reversal took place in November at $60, which carried prices back up just below $79. The reversal at $60 was personified by a classic hammer candlestick, with a long tail. By early January 2009, the rally that once galvanized RTH to rebound was fading into irrelevance at resistance near $79. It is no wonder that RTH had trouble rising above $79, because the 50% Fibonacci retracement is placed just above it at $80 (see Figure 1). This barrier of resistance at $79 is the same place where two previous recoveries had also failed during October 2008. In addition, a bearish rising wedge pattern formed at resistance. Eventually, RTH gapped lower in early January and broke the rising trendline that resulted in a penetration of horizontal support at $72.50. After three attempts to rise back above $72.50, RTH conceded to the bears and began its journey downward to once again test $60. |

|
| FIGURE 1: RTH, DAILY. The test of support may carry RTH back up to the upper boundary of its falling price channel. The 50-day exponential moving average (EMA) will add to resistance, which resides just above that level. If the channel is broken, the next hurdle is horizontal resistance at $72.50 (dotted red line). RTH may climb all the way back to $79 for a test if the bullish cross on the stochastic causes it to awake from its nap. |
| Graphic provided by: StockCharts.com. |
| |
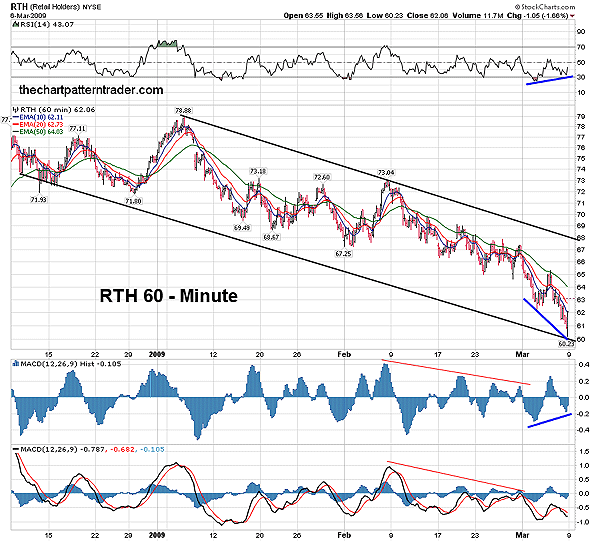
| With this recent test of support, prices are now range-bound between $60 and $79 since October 2008. As RTH tags support, it begs the question if another rally is in store that will help the retailers regain their footing, or will this level of support now be breached? With consumer spending down and the unemployment rate on the rise, it doesn't evoke a sense of confidence to most investors and traders, sending a message that retail sales will continue to struggle. But a consolidation phase can be a healthy sign; as a trading range develops, it builds a base of support as prices are essentially sidestepping. There are some clues at these levels that may offer a glimpse of hope to the bulls. First of all in Figure 1, another hammer candlestick occurred in March when prices reached support at $60 on RTH's daily chart, but this candlestick must receive confirmation by prices closing above the highest peak on the pattern. The hammer pattern may get its own stimulus package from the stochastic (14, 3, 3) indicator on the daily chart, which is starting to perk up and make its way toward 20. Moreover, in Figure 2, the hourly chart of RTH reveals that positive divergence has formed on the relative strength index (RSI) (14), while prices are in the lower part of the channel. |

|
| FIGURE 2: RTH, HOURLY. Here on the hourly chart of RTH there is positive divergence in place. Note that prices fell to new lows, tagging the lower boundary of the channel, while both the MACD histogram and RSI put in a higher low. The MACD may follow suit soon. |
| Graphic provided by: StockCharts.com. |
| |
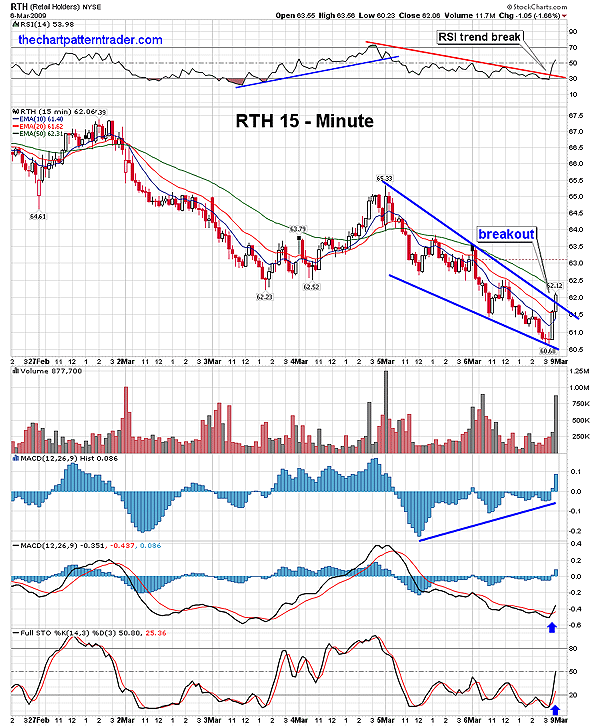
| The 15-minute chart of RTH also suggests a level of support at $60 (Figure 3). A bullish falling wedge has emerged in that time frame, which broke out in early March. The breakout resulted from yet another bullish divergence that formed on the moving average convergence/divergence (MACD) histogram (12, 26, 9). The divergence sparked prices to rise and the RSI (14) downtrend was broken. Volume was greatly intensified as prices rose, bringing about a bullish cross on the MACD, while the stochastic (14, 3, 3) snapped to attention and rose to 50. |

|
| FIGURE 3: RTH, 15-MINUTE. A solid breakout of a bullish falling wedge was a direct result of the bullish divergence on the MACD histogram, which gave an early warning that the MACD was about to get a bullish cross. The flood of buying broke the RSI downtrend and made the stochastic perk up. |
| Graphic provided by: StockCharts.com. |
| |
| The retail exchange traded fund (ETF) may be accumulating a confluence of support in various time frames at $60, with the daily chart offering horizontal support as prices on the hourly chart test the lower boundary of the falling price channel. Should RTH bounce off this intersection of support, it could climb back up to the upper boundary of the hourly channel near $67. Whether RTH has the fortitude and perseverance to break this downward cycle is uncertain. The ETF will either buck the trend once it reaches that level or a reaction will occur that could facilitate the bears to usurp power once again and seize the opportunity to drag the retailers below support. If prices break out of this ghastly downtrend, it may bring about a relief rally that carries RTH back up to overhead resistance at $79. |
| You may be stunned by the rapid price decay at resistance, or by the surge at support. But savvy traders of RTH anticipated a reversal at support, rather than react to it after it was too late. That's why prices surged back up when they touched support at $60. A slew of buy orders were triggered once prices slammed into support. Short-sellers also hastily scrambled to cover their positions. This is the perfect spot to speculate on a short-term long position, with a tight stop-loss order under support. In conclusion, RTH is showing some signs of promise. The lateral movement in RTH over the last several months may have caused ulcers to many investors, but the back & forth moves were received with open arms by day- and swing traders, who were so ready to buy support and sell resistance. |
Ron Walker is an active trader and technical analyst. He operates an educational website dedicated to the study of Technical Analysis. The website offers free market analysis with daily video presentations and written commentaries. Ron is a video pioneer, being one of the first to utilize the internet producing Technical Analysis videos. His website is thechartpatterntrader.com
| Website: | thechartpatterntrader.com |
| E-mail address: | thechartpatterntrader@gmail.com |
Click here for more information about our publications!
PRINT THIS ARTICLE

Request Information From Our Sponsors
- StockCharts.com, Inc.
- Candle Patterns
- Candlestick Charting Explained
- Intermarket Technical Analysis
- John Murphy on Chart Analysis
- John Murphy's Chart Pattern Recognition
- John Murphy's Market Message
- MurphyExplainsMarketAnalysis-Intermarket Analysis
- MurphyExplainsMarketAnalysis-Visual Analysis
- StockCharts.com
- Technical Analysis of the Financial Markets
- The Visual Investor
- VectorVest, Inc.
- Executive Premier Workshop
- One-Day Options Course
- OptionsPro
- Retirement Income Workshop
- Sure-Fire Trading Systems (VectorVest, Inc.)
- Trading as a Business Workshop
- VectorVest 7 EOD
- VectorVest 7 RealTime/IntraDay
- VectorVest AutoTester
- VectorVest Educational Services
- VectorVest OnLine
- VectorVest Options Analyzer
- VectorVest ProGraphics v6.0
- VectorVest ProTrader 7
- VectorVest RealTime Derby Tool
- VectorVest Simulator
- VectorVest Variator
- VectorVest Watchdog
