HOT TOPICS LIST
- MACD
- Fibonacci
- RSI
- Gann
- ADXR
- Stochastics
- Volume
- Triangles
- Futures
- Cycles
- Volatility
- ZIGZAG
- MESA
- Retracement
- Aroon
INDICATORS LIST
LIST OF TOPICS
PRINT THIS ARTICLE
by Austin Passamonte
Skilled traders recognize the basic price pattern on their charts. Repeated sequences of price bars in distinct pattern formation are merely human emotions of fear & greed measured with real money at work in the markets. Basic chart patterns have existed since paper charts were invented. Price patterns repeat in all markets through all charts, no matter the time frame. They function the same, regardless of all else. This is true of flags, pennants, and wedges.
Position: N/A
Austin Passamonte
Austin is a private trader who trades emini stock index futures intraday. He currently trades various futures markets from home in addition to managing a trader's educational forum
PRINT THIS ARTICLE
Intraday Flags, Pennants, & Wedges
03/09/09 11:13:17 AMby Austin Passamonte
Skilled traders recognize the basic price pattern on their charts. Repeated sequences of price bars in distinct pattern formation are merely human emotions of fear & greed measured with real money at work in the markets. Basic chart patterns have existed since paper charts were invented. Price patterns repeat in all markets through all charts, no matter the time frame. They function the same, regardless of all else. This is true of flags, pennants, and wedges.
Position: N/A
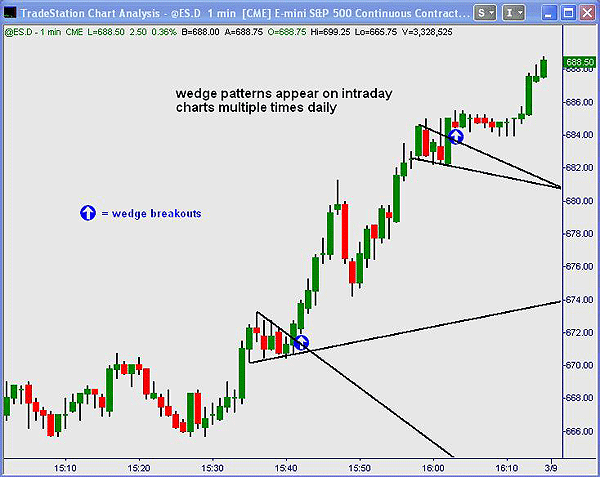
| Flags, pennants and wedges vary in style and shape. Sometimes, these patterns are rectangular or square, while at other times flags are shaped like triangles or wedges. Sequence of development remains the same. Price action made a directional move and is consolidating for the next leg. That push could be up, down, or sideways; from there, however, there are no guarantees. However, there is a bias for price patterns — consolidations to break out in continuation of the direction they were entered. Rising price action coils into a flag, which is more likely to keep moving upward when it breaks. The same is true for flag patterns breaking downward within a price move lower. See Figure 1. |

|
| FIGURE 1: INTRADAY CHARTS WEDGE PATTERNS |
| Graphic provided by: TradeStation. |
| |
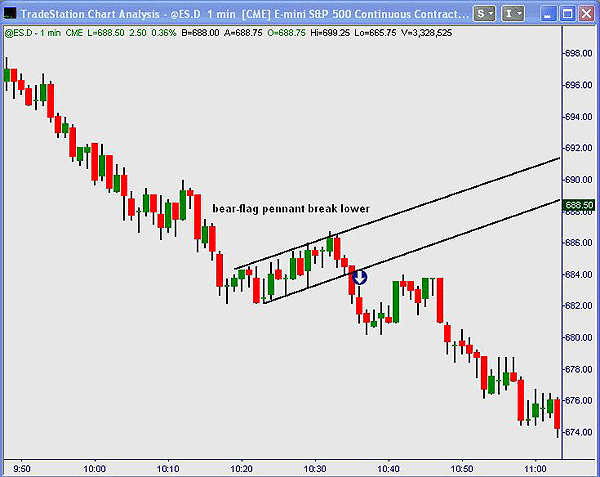
| Consolidation patterns identify structure within seeming randomness. They often form after price action has chopped or rolled sideways through indecision and then staged its first directional push outside of the neutral sideways range. Flagging patterns can be viewed as tipping points in the endless battle between buyers and sellers. While the pause pattern has formed, each side pushes equally hard and cannot move price action in either direction. Eventually, one side or the other prevails. Whether it is the buyers or sellers, that first directional break from a consolidated range catches the other side by surprise. Buyers are not convinced a market is going lower, and sellers aren't convinced the market is going higher when the first real push begins. Flags are the result of the losing side pressing their case in a futile effort, one more time. See Figure 2. |

|
| FIGURE 2: BEAR-FLAG PENNANT BREAKS LOWER |
| Graphic provided by: TradeStation. |
| |
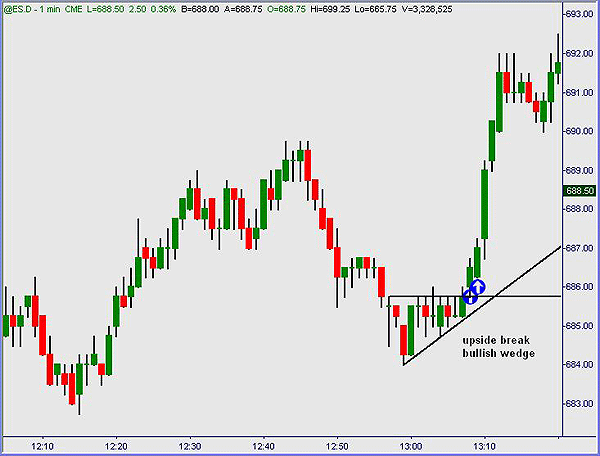
| You can think of price action in financial markets as a continual game of tug-of-war. Buyers and sellers pull the tape in both directions in an attempt to enforce their desire or will. Much, if not most of the time, each side is pretty well matched. At certain points of time, one side or the other will clearly overwhelm the other. Price action breaking out of flag patterns is one of those times where the tipping point is visible, and one side or the other tugging on that proverbial rope is about to be dragged through the mud pit. See Figure 3. |

|
| FIGURE 3: UPSIDE BREAK BULLISH WEDGE |
| Graphic provided by: TradeStation. |
| |
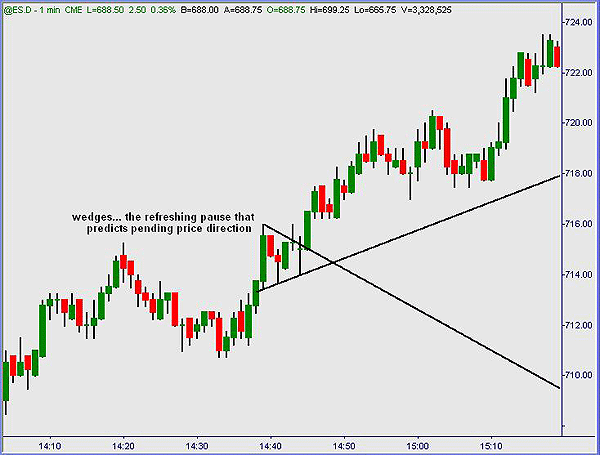
| Intraday traders working just about any market can easily learn to see these consolidation patterns daily. Various tactics exist to trade pullbacks inside of or breakouts from consolidation patterns. Whether used as part of a specific trade entry technique or a general measurement of pending price direction, flags, pennants, and wedges are invaluable clues on where price action is probable to head next. See Figure 4. |

|
| FIGURE 4: WEDGES. Here's the refreshing pause that predicts pending price direction. |
| Graphic provided by: TradeStation. |
| |
| Simple price patterns have always worked in the past; they still work today. It is the pure measurement of market behavior going through its cycle of range expansion and contraction in visible form. That does not mean that patterns and/or pattern breakouts can be worked as pure trade signals or entry points on their own — sometimes, but not always. However, knowing how to spot, read, and measure price flags on a chart will give you a clear picture of what is probable to happen next — an edge to position yourself long or short as consolidation leads to expansion ahead. |
Austin is a private trader who trades emini stock index futures intraday. He currently trades various futures markets from home in addition to managing a trader's educational forum
| Title: | Individual Trader |
| Company: | CoiledMarkets.com |
| Address: | PO Box 633 |
| Naples, NY 14512 | |
| Website: | coiledmarkets.com/blog |
| E-mail address: | austinp44@yahoo.com |
Traders' Resource Links | |
| CoiledMarkets.com has not added any product or service information to TRADERS' RESOURCE. | |
Click here for more information about our publications!
Comments
Date: 03/10/09Rank: 4Comment:

Request Information From Our Sponsors
- StockCharts.com, Inc.
- Candle Patterns
- Candlestick Charting Explained
- Intermarket Technical Analysis
- John Murphy on Chart Analysis
- John Murphy's Chart Pattern Recognition
- John Murphy's Market Message
- MurphyExplainsMarketAnalysis-Intermarket Analysis
- MurphyExplainsMarketAnalysis-Visual Analysis
- StockCharts.com
- Technical Analysis of the Financial Markets
- The Visual Investor
- VectorVest, Inc.
- Executive Premier Workshop
- One-Day Options Course
- OptionsPro
- Retirement Income Workshop
- Sure-Fire Trading Systems (VectorVest, Inc.)
- Trading as a Business Workshop
- VectorVest 7 EOD
- VectorVest 7 RealTime/IntraDay
- VectorVest AutoTester
- VectorVest Educational Services
- VectorVest OnLine
- VectorVest Options Analyzer
- VectorVest ProGraphics v6.0
- VectorVest ProTrader 7
- VectorVest RealTime Derby Tool
- VectorVest Simulator
- VectorVest Variator
- VectorVest Watchdog
