HOT TOPICS LIST
- MACD
- Fibonacci
- RSI
- Gann
- ADXR
- Stochastics
- Volume
- Triangles
- Futures
- Cycles
- Volatility
- ZIGZAG
- MESA
- Retracement
- Aroon
INDICATORS LIST
LIST OF TOPICS
PRINT THIS ARTICLE
by James Kupfer
Gold has potentially put in an intermediate-term top.
Position: Sell
James Kupfer
Mr. Kupfer is a market professional and amateur stock market commentator. Disclosure: It is likely that Mr. Kupfer has or will enter a position in any security he writes about.
PRINT THIS ARTICLE
STOCHASTICS
Gold Rolling Over
03/09/09 10:14:25 AMby James Kupfer
Gold has potentially put in an intermediate-term top.
Position: Sell
| On February 19, 2009 (posted on 2/25), I made the cyclical case for why gold was likely to be approaching an intermediate top. In that article I stated, "Should gold make it above the $988 region, there is further resistance at the $1,010 and $1,025 levels." The next day, gold made an intraday high of $1,007.70. |
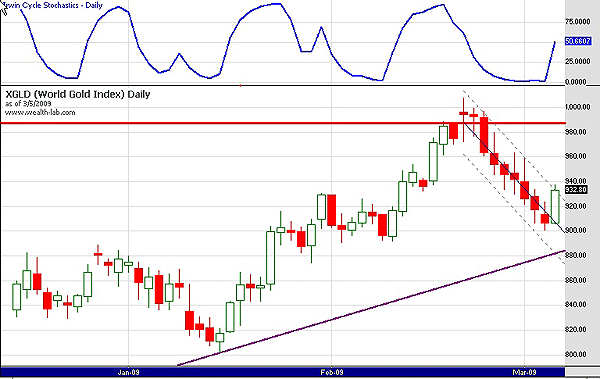
| Looking at an updated daily chart (see Figure 1), we can see that gold has formed a linear regression channel. The channel itself is very steep, so much so that it is unsustainable. After having so many consecutive down days, gold reached a very oversold level, so the large up day on March 5 was a necessary relief rally. This will provide an important test for gold. If the resulting rally fails to climb above the previous top, then in all likelihood the intermediate top has been made. |

|
| FIGURE 1: XGLD, DAILY. Note that gold has formed a linear regression channel here. |
| Graphic provided by: Wealth-Lab. |
| |
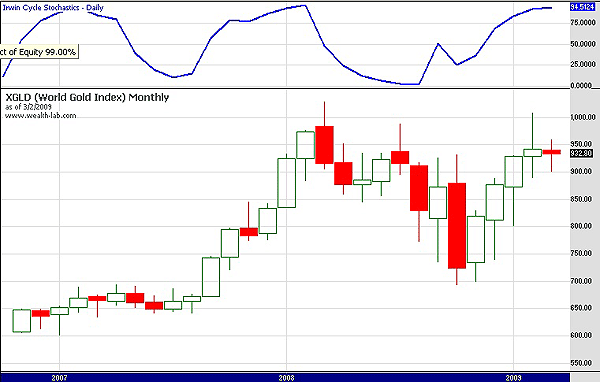
| Looking at a monthly gold chart (Figure 2), the most important thing to note is that monthly stochastics are very overbought and beginning to turn down. Stochastics accurately helped identify the last few major tops in gold and is likely doing so now. In sum, there is significant evidence that gold has reached a significant top. Assuming this is the case, gold should eventually drop below $700. |

|
| FIGURE 2: XGLD, MONTHLY. Monthly stochastics are very overbought and beginning to turn down. |
| Graphic provided by: Wealth-Lab. |
| |
Mr. Kupfer is a market professional and amateur stock market commentator. Disclosure: It is likely that Mr. Kupfer has or will enter a position in any security he writes about.
Click here for more information about our publications!
Comments
Date: 03/10/09Rank: 5Comment:

Request Information From Our Sponsors
- StockCharts.com, Inc.
- Candle Patterns
- Candlestick Charting Explained
- Intermarket Technical Analysis
- John Murphy on Chart Analysis
- John Murphy's Chart Pattern Recognition
- John Murphy's Market Message
- MurphyExplainsMarketAnalysis-Intermarket Analysis
- MurphyExplainsMarketAnalysis-Visual Analysis
- StockCharts.com
- Technical Analysis of the Financial Markets
- The Visual Investor
- VectorVest, Inc.
- Executive Premier Workshop
- One-Day Options Course
- OptionsPro
- Retirement Income Workshop
- Sure-Fire Trading Systems (VectorVest, Inc.)
- Trading as a Business Workshop
- VectorVest 7 EOD
- VectorVest 7 RealTime/IntraDay
- VectorVest AutoTester
- VectorVest Educational Services
- VectorVest OnLine
- VectorVest Options Analyzer
- VectorVest ProGraphics v6.0
- VectorVest ProTrader 7
- VectorVest RealTime Derby Tool
- VectorVest Simulator
- VectorVest Variator
- VectorVest Watchdog
