HOT TOPICS LIST
- MACD
- Fibonacci
- RSI
- Gann
- ADXR
- Stochastics
- Volume
- Triangles
- Futures
- Cycles
- Volatility
- ZIGZAG
- MESA
- Retracement
- Aroon
INDICATORS LIST
LIST OF TOPICS
PRINT THIS ARTICLE
by James Kupfer
Range Resources is worth watching for a potential breakout.
Position: Hold
James Kupfer
Mr. Kupfer is a market professional and amateur stock market commentator. Disclosure: It is likely that Mr. Kupfer has or will enter a position in any security he writes about.
PRINT THIS ARTICLE
SYMMETRICAL TRIANGLE
Range Resources Triangle
03/06/09 09:03:43 AMby James Kupfer
Range Resources is worth watching for a potential breakout.
Position: Hold
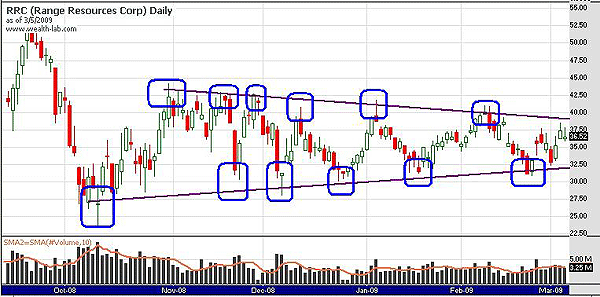
| Shares of Range Resources (RRC) have spent the last six months forming a symmetrical triangle pattern. In such a triangle, a trendline drawn both above and below the stock price contracts over time, starting wide and getting continually smaller until such time as a breakout occurs. |

|
| FIGURE 1: RRC, DAILY. Blue ovals show all reversal points on the triangle. |
| Graphic provided by: Wealth-Lab. |
| |
| With a triangle formation, the best course of action is normally to wait for a breakout either up or down. While it has been suggested that most of the breakouts occur in the direction of the original trend — in this case, down — wait to see what the stock decides to do. |
| Once a breakout does occur, the price target can be determined by adding the difference between the two oldest points from the start of the pattern and adding or subtracting to the breakout point. In this case, that would be roughly $42.50 - $30 +/- breakout point. |
Mr. Kupfer is a market professional and amateur stock market commentator. Disclosure: It is likely that Mr. Kupfer has or will enter a position in any security he writes about.
Click here for more information about our publications!
PRINT THIS ARTICLE

Request Information From Our Sponsors
- VectorVest, Inc.
- Executive Premier Workshop
- One-Day Options Course
- OptionsPro
- Retirement Income Workshop
- Sure-Fire Trading Systems (VectorVest, Inc.)
- Trading as a Business Workshop
- VectorVest 7 EOD
- VectorVest 7 RealTime/IntraDay
- VectorVest AutoTester
- VectorVest Educational Services
- VectorVest OnLine
- VectorVest Options Analyzer
- VectorVest ProGraphics v6.0
- VectorVest ProTrader 7
- VectorVest RealTime Derby Tool
- VectorVest Simulator
- VectorVest Variator
- VectorVest Watchdog
- StockCharts.com, Inc.
- Candle Patterns
- Candlestick Charting Explained
- Intermarket Technical Analysis
- John Murphy on Chart Analysis
- John Murphy's Chart Pattern Recognition
- John Murphy's Market Message
- MurphyExplainsMarketAnalysis-Intermarket Analysis
- MurphyExplainsMarketAnalysis-Visual Analysis
- StockCharts.com
- Technical Analysis of the Financial Markets
- The Visual Investor
