HOT TOPICS LIST
- MACD
- Fibonacci
- RSI
- Gann
- ADXR
- Stochastics
- Volume
- Triangles
- Futures
- Cycles
- Volatility
- ZIGZAG
- MESA
- Retracement
- Aroon
INDICATORS LIST
LIST OF TOPICS
PRINT THIS ARTICLE
by James Kupfer
The Dow Jones Industrial Average has formed a very steep downsloping channel.
Position: Hold
James Kupfer
Mr. Kupfer is a market professional and amateur stock market commentator. Disclosure: It is likely that Mr. Kupfer has or will enter a position in any security he writes about.
PRINT THIS ARTICLE
LINEAR REG CHANNEL
The Dow(n) Channel
03/06/09 08:59:37 AMby James Kupfer
The Dow Jones Industrial Average has formed a very steep downsloping channel.
Position: Hold
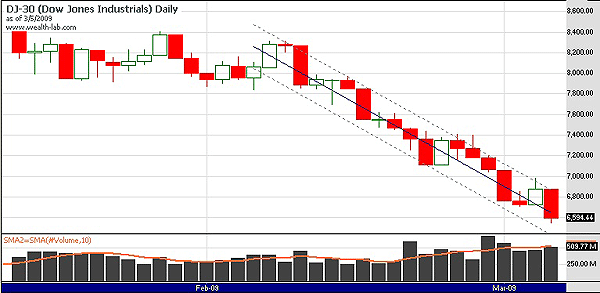
| On February 10, the US equity markets started breaking down (yet again) and began the formation of what has turned out to be a steep and narrow downward-sloping trend channel. This downward move has also come with a healthy increase in volume. While this channel makes the chart look foreboding, it will make it easier to determine when the market turns back up. |
| As I laid out in my February 20th post, there is a cluster of Fibonacci support levels at 6436, 6422, and 6247. With the close on March 5, at 6594 the DJIA is less than 200 points away from the first of these levels. This represents the best opportunity for the DJIA to reverse direction. |

|
| FIGURE 1: DJIA, DAILY. A strong downtrend has begun, but the slope is not sustainable. |
| Graphic provided by: Wealth-Lab. |
| |
| Assuming the DJIA drops to the 6400 level or even further, watch for a significant break and close above the channel boundary. I would define this as a close 3% above the upper channel line or three consecutive days of closes above it. Once this occurs it will be time to buy. |
Mr. Kupfer is a market professional and amateur stock market commentator. Disclosure: It is likely that Mr. Kupfer has or will enter a position in any security he writes about.
Click here for more information about our publications!
Comments
Date: 03/10/09Rank: 4Comment:

Request Information From Our Sponsors
- VectorVest, Inc.
- Executive Premier Workshop
- One-Day Options Course
- OptionsPro
- Retirement Income Workshop
- Sure-Fire Trading Systems (VectorVest, Inc.)
- Trading as a Business Workshop
- VectorVest 7 EOD
- VectorVest 7 RealTime/IntraDay
- VectorVest AutoTester
- VectorVest Educational Services
- VectorVest OnLine
- VectorVest Options Analyzer
- VectorVest ProGraphics v6.0
- VectorVest ProTrader 7
- VectorVest RealTime Derby Tool
- VectorVest Simulator
- VectorVest Variator
- VectorVest Watchdog
- StockCharts.com, Inc.
- Candle Patterns
- Candlestick Charting Explained
- Intermarket Technical Analysis
- John Murphy on Chart Analysis
- John Murphy's Chart Pattern Recognition
- John Murphy's Market Message
- MurphyExplainsMarketAnalysis-Intermarket Analysis
- MurphyExplainsMarketAnalysis-Visual Analysis
- StockCharts.com
- Technical Analysis of the Financial Markets
- The Visual Investor
