

HOT TOPICS LIST
- MACD
- Fibonacci
- RSI
- Gann
- ADXR
- Stochastics
- Volume
- Triangles
- Futures
- Cycles
- Volatility
- ZIGZAG
- MESA
- Retracement
- Aroon
INDICATORS LIST
LIST OF TOPICS
PRINT THIS ARTICLE
by Koos van der Merwe
Is this A-B base the future market bottom picture?
Position: Accumulate
Koos van der Merwe
Has been a technical analyst since 1969, and has worked as a futures and options trader with First Financial Futures in Johannesburg, South Africa.
PRINT THIS ARTICLE
ELLIOTT WAVE
Is The A-B Base What The Bottom Will Look Like?
03/06/09 08:45:02 AMby Koos van der Merwe
Is this A-B base the future market bottom picture?
Position: Accumulate
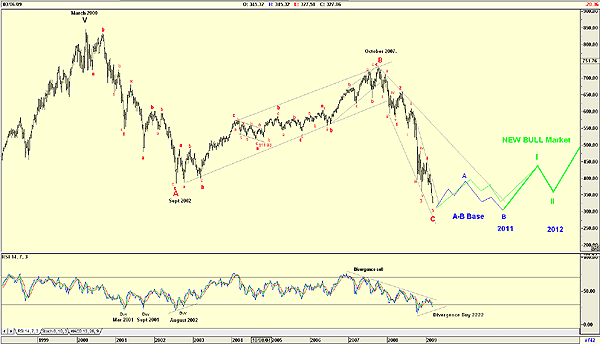
| Readers have emailed me to ask whether I still believe that the stock market is near or at a bottom. To answer their question, I have chosen a weekly chart of the Standard & Poor's 100 to analyze (Figure 1). I have chosen a weekly chart because a daily chart offers too many waves and should be used for fine-tuning only, and a monthly chart is for long-term analysis only. My analysis will hopefully allow those readers to sleep better at night. |
|
| FIGURE 1: S&P 100, WEEKLY |
| Graphic provided by: AdvancedGET. |
| |
| Figure 1 shows my Elliott wave count from 1999 to the present, a period of 10 years. I have shown the fifth-wave top as being March 2000 as the tech bubble burst. Wave A, as we all know by now, was in September 2002, with the top of wave B the start of the present recession in October 2007. Unlike the Standard & Poor's 500, the top of wave B is not higher than wave V, so the S&P 100, like the chart of the Dow Jones Industrial Average (DJIA), is not suggesting a flat wave C, which means that wave C will fall in a five-wave pattern and will fall beyond the low of wave A. The chart shows that this has occurred. |
| A positive sign that the end of the bear market is at hand is the wave count of wave C, which does appear to be nearing completion. The relative strength index (RSI) seems to be suggesting that a divergence buy signal is in the offing. The RSI has not been that successful as shown, where in March and September 2001, both buy signals were short-term buys only. However, in August 2002, the divergence buy signal was successful in calling a bottom, which suggests that when the present divergence does materialize — if it does — then it could also be a success. If this is truly a C-wave bottom developing, then what about the future? In the chart I have drawn in what is called the "A-B base." In his book Nature's Law, Ralph Nelson Elliott twice referred to a structure called an "A-B base." He believed that after a major decline ended on a satisfactory count, the market would advance in three waves, and then decline in three waves prior to the commencement of the new bull market. This theory does suggest a rounding bottom, a period of burial for the bear's corpse. The A-B base does have its detractors, the strongest being Robert Prechter (coauthor of Elliott Wave Principle with AJ Frost), who believes that Ralph Elliott invented this wave to "force his principle into the 13-year triangle concept." I admit that the A-B base would cause the wave count to fit beautifully into the Kondratieff wave theory (an earlier Traders.com Advantage article of mine). Should we, however, stick to keeping a simple wave count, then we could argue that the A-B base is simply part of the wave I formation of the new bull market, which according to the Kondratieff wave theory should only start in 2012, give or take a year. In Figure 1 I have drawn in both suggestions, the A-B base in blue and the possible wave I formation in light green. Whatever the final outcome, it does suggest a long and slow recovery — a rounding bottom as the maggots on the bear's corpse slowly consume the rotting flesh. To conclude: Yes, I do believe that the bottom is almost in place if not already in place. However, I also believe that the recovery will be slow, no "V" bottom recovery that most analysts hope for. That bear's corpse is truly a big one. |
Has been a technical analyst since 1969, and has worked as a futures and options trader with First Financial Futures in Johannesburg, South Africa.
| Address: | 3256 West 24th Ave |
| Vancouver, BC | |
| Phone # for sales: | 6042634214 |
| E-mail address: | petroosp@gmail.com |
Click here for more information about our publications!
Comments
Date:�03/10/09Rank:�4Comment:�

Request Information From Our Sponsors
- StockCharts.com, Inc.
- Candle Patterns
- Candlestick Charting Explained
- Intermarket Technical Analysis
- John Murphy on Chart Analysis
- John Murphy's Chart Pattern Recognition
- John Murphy's Market Message
- MurphyExplainsMarketAnalysis-Intermarket Analysis
- MurphyExplainsMarketAnalysis-Visual Analysis
- StockCharts.com
- Technical Analysis of the Financial Markets
- The Visual Investor
- VectorVest, Inc.
- Executive Premier Workshop
- One-Day Options Course
- OptionsPro
- Retirement Income Workshop
- Sure-Fire Trading Systems (VectorVest, Inc.)
- Trading as a Business Workshop
- VectorVest 7 EOD
- VectorVest 7 RealTime/IntraDay
- VectorVest AutoTester
- VectorVest Educational Services
- VectorVest OnLine
- VectorVest Options Analyzer
- VectorVest ProGraphics v6.0
- VectorVest ProTrader 7
- VectorVest RealTime Derby Tool
- VectorVest Simulator
- VectorVest Variator
- VectorVest Watchdog