HOT TOPICS LIST
- MACD
- Fibonacci
- RSI
- Gann
- ADXR
- Stochastics
- Volume
- Triangles
- Futures
- Cycles
- Volatility
- ZIGZAG
- MESA
- Retracement
- Aroon
INDICATORS LIST
LIST OF TOPICS
PRINT THIS ARTICLE
by Donald W. Pendergast, Jr.
When will natural gas finally find a solid floor? Money flow analysis may offer some clues.
Position: Accumulate
Donald W. Pendergast, Jr.
Donald W. Pendergast is a financial markets consultant who offers specialized services to stock brokers and high net worth individuals who seek a better bottom line for their portfolios.
PRINT THIS ARTICLE
ACCUM./DIST. CHAIKIN
Money Flows Improving For Natural Gas
03/06/09 08:15:21 AMby Donald W. Pendergast, Jr.
When will natural gas finally find a solid floor? Money flow analysis may offer some clues.
Position: Accumulate
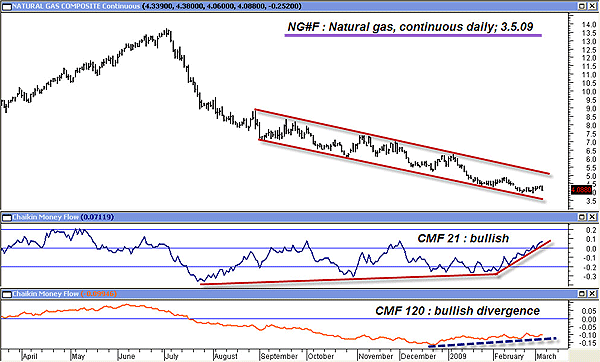
| Natural gas has fallen about 70% from last summer's highs, and, at first glance, there appears to be little hope of a rebound anytime soon. However, there may be several indications that the smart money is gradually building up their positions in this essential energy commodity. |

|
| FIGURE 1: NG, DAILY. Analyzing the short-term and long-term money flow of a given security may be beneficial to traders seeking advance warning of trend reversals. Bullish divergences are evident here as money flows into natural gas. |
| Graphic provided by: MetaStock. |
| |
| Figure 1, a daily chart of natural gas (continuous contract basis), is devoid of all but two critical measures — the Chaikin money flow (CMF) of the past 21 and 120 sessions. The CMF is calculated by adding the values of the accumulation/distribution line for a specified number of periods (in this case, 21 and 120 periods, respectively) and then dividing the result by the volume totals of the 21- and 120-day periods, respectively. In a nutshell, the CMF is simply a visual display of money flowing into and out of any given security. Right now, there is bullish money flow divergence on both the short (21-period) and the long (120-period) time frame, despite the fact that natural gas prices are still gradually falling. At some point, this situation must rectify itself, and given that the Commitment of Traders data for the past several months suggests a steady accumulation of long contracts by commercial interests, it's likely that many commodity traders will be monitoring this market carefully, looking for signs of a bullish breakout. Breakouts can be tricky, however — is there another method used by professional traders with deep pockets? |
| Scale trading isn't appropriate for small futures trading accounts, since it involves buying more contracts as price falls. The idea is to be reasonably certain that a major cyclical and/or seasonal low is due before committing to such a major plan of accumulation. Pyramiding down might have a professional trader buy one contract at $4.00, two more at $3.75, three more at $3.50, four more at $3.25, and so on. If he's right about initiating his series of buys as the major low holds, and then prices rebound strongly, his average cost would only be about $3.50 each for the first 10 contracts. A rally up to $4.00 might have him sell all the contracts for a net gain of $0.50 per contract. Of course, if natural gas kept falling, he'd obviously have to have a bailout point at which to liquidate all of the contracts — at a loss. Timing, as they say, is everything, but with a carefully considered scale trading program, a trader's timing doesn't have to be that precise. Knowledge of seasonal, cyclical, and COT trends is essential for success, however. |
| Fortunately for equity traders, commodity trading can be as easy as trading a stock, thanks to the huge proliferation in commodity exchange traded funds (ETFs) during this decade. Traders looking to scale into natural gas can use the United States Natural Gas ETF (UNG) to get in on the action in the futures market. The great thing about this is that no margin is required, making it suitable for small-time investors and traders who want to learn how to trade commodities with substantially less risk. |
Donald W. Pendergast is a financial markets consultant who offers specialized services to stock brokers and high net worth individuals who seek a better bottom line for their portfolios.
| Title: | Writer, market consultant |
| Company: | Linear Trading Systems LLC |
| Jacksonville, FL 32217 | |
| Phone # for sales: | 904-239-9564 |
| E-mail address: | lineartradingsys@gmail.com |
Traders' Resource Links | |
| Linear Trading Systems LLC has not added any product or service information to TRADERS' RESOURCE. | |
Click here for more information about our publications!
PRINT THIS ARTICLE

Request Information From Our Sponsors
- VectorVest, Inc.
- Executive Premier Workshop
- One-Day Options Course
- OptionsPro
- Retirement Income Workshop
- Sure-Fire Trading Systems (VectorVest, Inc.)
- Trading as a Business Workshop
- VectorVest 7 EOD
- VectorVest 7 RealTime/IntraDay
- VectorVest AutoTester
- VectorVest Educational Services
- VectorVest OnLine
- VectorVest Options Analyzer
- VectorVest ProGraphics v6.0
- VectorVest ProTrader 7
- VectorVest RealTime Derby Tool
- VectorVest Simulator
- VectorVest Variator
- VectorVest Watchdog
- StockCharts.com, Inc.
- Candle Patterns
- Candlestick Charting Explained
- Intermarket Technical Analysis
- John Murphy on Chart Analysis
- John Murphy's Chart Pattern Recognition
- John Murphy's Market Message
- MurphyExplainsMarketAnalysis-Intermarket Analysis
- MurphyExplainsMarketAnalysis-Visual Analysis
- StockCharts.com
- Technical Analysis of the Financial Markets
- The Visual Investor
