

HOT TOPICS LIST
- MACD
- Fibonacci
- RSI
- Gann
- ADXR
- Stochastics
- Volume
- Triangles
- Futures
- Cycles
- Volatility
- ZIGZAG
- MESA
- Retracement
- Aroon
INDICATORS LIST
LIST OF TOPICS
PRINT THIS ARTICLE
by Alan R. Northam
GLD made a bull market top in March 2008. Since then, GLD has been consolidating its gain from its 1999 runup. The target price for the completion of the consolidation in GLD is calculated at $66.
Position: N/A
Alan R. Northam
Alan Northam lives in the Dallas, Texas area and as an electronic engineer gave him an analytical mind from which he has developed a thorough knowledge of stock market technical analysis. His abilities to analyze the future direction of the stock market has allowed him to successfully trade of his own portfolio over the last 30 years. Mr. Northam is now retired and trading the stock market full time. You can reach him at inquiry@tradersclassroom.com or by visiting his website at http://www.tradersclassroom.com. You can also follow him on Twitter @TradersClassrm.
PRINT THIS ARTICLE
ELLIOTT WAVE
Gold Turns Down
03/06/09 09:16:27 AMby Alan R. Northam
GLD made a bull market top in March 2008. Since then, GLD has been consolidating its gain from its 1999 runup. The target price for the completion of the consolidation in GLD is calculated at $66.
Position: N/A
| In my last article entitled "Gold Turning Down" published December 23, 2008, I reported that gold had completed an ABC corrective Elliott wave pattern and gold was set to move lower. However, as sometimes happens, the corrective wave structure extended to form a double ABC corrective wave structure to complete the larger B wave that ended in late February 2009. In some instances, a corrective wave pattern can extend three times before being complete; Elliott wave theory calls these "combinations." Combinations are rather rare, and as such, the probability of the market correction in gold extending again is low, but is still a possibility. If gold does extend for a third time, I will address the alternate Elliott wave structure at that time. However, here is what I expect is developing: |
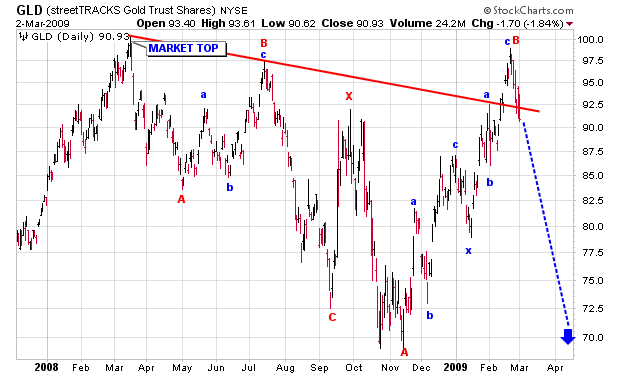
| Figure 1 shows the daily bar chart of GLD. This chart shows that GLD made a major bull market top in March 2008. Since then, GLD moved lower, forming an Elliott wave ABC zigzag corrective wave structure that ended in early September 2008. From early September to the end of September, GLD formed an X wave. X waves are connecting waves that connect multiple corrective waves together. From late September to mid-November 2008, GLD formed wave A of an extended flat corrective wave. From mid-November to late February 2009, GLD formed wave B of the extended flat correction. Wave B itself was formed by two smaller abc zigzag corrective waves connected by an x wave. With wave B now complete, the final wave C down of the extended flat is now under way. Wave C of extended flat corrective wave structures are normally 1.618 times the length of wave A. This then calculates to $66, the target price for the completion of wave C. |
|
| Figure 1. Daily price chart of the StreetTracks Gold trust Shares, stock symbol GLD. This chart shows the Elliott Wave count and points to a price target of $66.00 per share. |
| Graphic provided by: StockCharts.com. |
| |
| In conclusion, gold has now completed a double abc zigzag corrective wave structure off the mid-November 2008 price low. These two completed wave structures satisfy the Elliott wave requirement for the completion of the B wave of an extended flat corrective wave structure. This then signals that wave C of the extended flat should now be under way. According to the Elliott wave guidelines, wave C of extended flat corrections are typically 1.618 times the length of wave A, marking the target price for the completion of wave C and the extended flat corrective wave structure at $66. |
Alan Northam lives in the Dallas, Texas area and as an electronic engineer gave him an analytical mind from which he has developed a thorough knowledge of stock market technical analysis. His abilities to analyze the future direction of the stock market has allowed him to successfully trade of his own portfolio over the last 30 years. Mr. Northam is now retired and trading the stock market full time. You can reach him at inquiry@tradersclassroom.com or by visiting his website at http://www.tradersclassroom.com. You can also follow him on Twitter @TradersClassrm.
| Garland, Tx | |
| Website: | www.tradersclassroom.com |
| E-mail address: | inquiry@tradersclassroom.com |
Click here for more information about our publications!
Comments
Date:�03/10/09Rank:�5Comment:�

Request Information From Our Sponsors
- StockCharts.com, Inc.
- Candle Patterns
- Candlestick Charting Explained
- Intermarket Technical Analysis
- John Murphy on Chart Analysis
- John Murphy's Chart Pattern Recognition
- John Murphy's Market Message
- MurphyExplainsMarketAnalysis-Intermarket Analysis
- MurphyExplainsMarketAnalysis-Visual Analysis
- StockCharts.com
- Technical Analysis of the Financial Markets
- The Visual Investor
- VectorVest, Inc.
- Executive Premier Workshop
- One-Day Options Course
- OptionsPro
- Retirement Income Workshop
- Sure-Fire Trading Systems (VectorVest, Inc.)
- Trading as a Business Workshop
- VectorVest 7 EOD
- VectorVest 7 RealTime/IntraDay
- VectorVest AutoTester
- VectorVest Educational Services
- VectorVest OnLine
- VectorVest Options Analyzer
- VectorVest ProGraphics v6.0
- VectorVest ProTrader 7
- VectorVest RealTime Derby Tool
- VectorVest Simulator
- VectorVest Variator
- VectorVest Watchdog