

HOT TOPICS LIST
- MACD
- Fibonacci
- RSI
- Gann
- ADXR
- Stochastics
- Volume
- Triangles
- Futures
- Cycles
- Volatility
- ZIGZAG
- MESA
- Retracement
- Aroon
INDICATORS LIST
LIST OF TOPICS
PRINT THIS ARTICLE
by Chaitali Mohile
Verizon Communications consolidated after its head & shoulders bearish breakout. The stock is likely to resume its breakout journey and may open good short-selling opportunities.
Position: Sell
Chaitali Mohile
Active trader in the Indian stock markets since 2003 and a full-time writer. Trading is largely based upon technical analysis.
PRINT THIS ARTICLE
HEAD & SHOULDERS
Verizon Communications On A Downward Track
03/05/09 02:33:35 PMby Chaitali Mohile
Verizon Communications consolidated after its head & shoulders bearish breakout. The stock is likely to resume its breakout journey and may open good short-selling opportunities.
Position: Sell
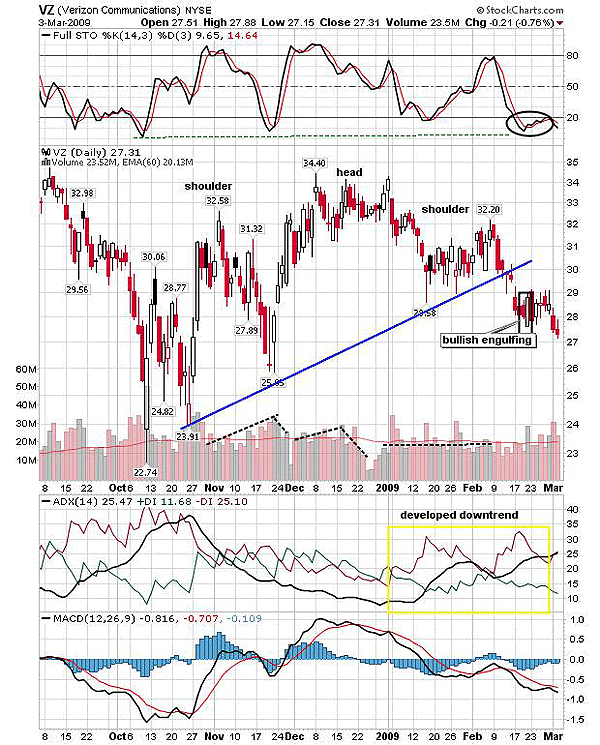
| The head & shoulders pattern with an ascending neckline support in the chart of Verizon Communication (VZ) in Figure 1 has broken out in a bearish direction. The volume during the left shoulder formation was comparatively high than the head and the right shoulder of the pattern. This reconfirms the valid formation. Head & shoulders is a major trend reversal pattern. The formation may take a time span of 12 weeks to several months to complete. But the larger the pattern, the higher the breakout reliability. In Figure 1, the pattern is five months old and has already converted the neckline support to resistance. VZ consolidated after the breakout instead of retracing back to retest the newly formed neckline resistance. |
|
| FIGURE 1: VZ, DAILY. The breakout rally consolidated much below the ascending neckline resistance. The stock has recently moved below the consolidation range. |
| Graphic provided by: StockCharts.com. |
| |
| VZ formed a bullish engulfing pattern while consolidating, indicating the possibility of an upward rally toward the neckline resistance. The stochastic (14,3,3) was equally ready to surge above an oversold level. Therefore, to know the direction of price movement, I added VZ in the list of my favorite stocks. There were two possibilities for the breakout rally. First, the stock would have rushed to challenge the fresh neckline resistance and then initiate a downward journey to achieve the potential target. The second possibility was a failed breakout due to the consolidation. |
| However, the developing downtrend and the declining moving average convergence/divergence (MACD)(12,26,9) pulled the price below the consolidation range. The average directional movement index (ADX) (14), a trend indicator in Figure 1, indicates a developing downtrend. On these bearish notes, VZ began its downward breakout rally. The minimum estimated level can be measured by calculating the distance between the neckline and head. Therefore, the distance is 34 - 25 = 9. Subtracting 9 from the breakout at $30 will give us a target of $21. Here, we have to consider the neckline breakout and not the consolidation range breakout. |
| Thus, traders can enter short positions with a target of $21 with the stop-loss at $30 (the breakout level). |

|
| FIGURE 2: VZ, WEEKLY. The doji and the hanging man below the neckline resistance indicate the bearish pressure on the breakout rally. |
| Graphic provided by: StockCharts.com. |
| |
| The head & shoulders with the ascending neckline is seen in Figure 2 as well. The reliability of the pattern as well as the breakout increases if the same pattern appears on two different time frames. Hence, the head & shoulders in Figure 2 is highly dependable. We can see a bearish engulfing pattern on the right shoulder (the marked circle). The candlestick pattern indicated a fresh bearish rally. The downward breakout of the head & shoulder was thus reconfirmed by the bearish reversal candlestick pattern. The stochastic (14,3,3) has sufficient space for a descending rally. The ADX (14) at 21 suggests a developing downtrend, and the MACD (12,26,9) shows a bearish crossover in negative territory. Therefore, the overall picture suggests more downside for VZ and the possibility of it hitting its $21 target. |
Active trader in the Indian stock markets since 2003 and a full-time writer. Trading is largely based upon technical analysis.
| Company: | Independent |
| Address: | C1/3 Parth Indraprasth Towers. Vastrapur |
| Ahmedabad, Guj 380015 | |
| E-mail address: | chaitalimohile@yahoo.co.in |
Traders' Resource Links | |
| Independent has not added any product or service information to TRADERS' RESOURCE. | |
Click here for more information about our publications!
PRINT THIS ARTICLE

Request Information From Our Sponsors
- StockCharts.com, Inc.
- Candle Patterns
- Candlestick Charting Explained
- Intermarket Technical Analysis
- John Murphy on Chart Analysis
- John Murphy's Chart Pattern Recognition
- John Murphy's Market Message
- MurphyExplainsMarketAnalysis-Intermarket Analysis
- MurphyExplainsMarketAnalysis-Visual Analysis
- StockCharts.com
- Technical Analysis of the Financial Markets
- The Visual Investor
- VectorVest, Inc.
- Executive Premier Workshop
- One-Day Options Course
- OptionsPro
- Retirement Income Workshop
- Sure-Fire Trading Systems (VectorVest, Inc.)
- Trading as a Business Workshop
- VectorVest 7 EOD
- VectorVest 7 RealTime/IntraDay
- VectorVest AutoTester
- VectorVest Educational Services
- VectorVest OnLine
- VectorVest Options Analyzer
- VectorVest ProGraphics v6.0
- VectorVest ProTrader 7
- VectorVest RealTime Derby Tool
- VectorVest Simulator
- VectorVest Variator
- VectorVest Watchdog