HOT TOPICS LIST
- MACD
- Fibonacci
- RSI
- Gann
- ADXR
- Stochastics
- Volume
- Triangles
- Futures
- Cycles
- Volatility
- ZIGZAG
- MESA
- Retracement
- Aroon
INDICATORS LIST
LIST OF TOPICS
PRINT THIS ARTICLE
by Chaitali Mohile
The Light-Crude Oil Index is likely to lose its past week's gains under the bearish shadows.
Position: N/A
Chaitali Mohile
Active trader in the Indian stock markets since 2003 and a full-time writer. Trading is largely based upon technical analysis.
PRINT THIS ARTICLE
CANDLESTICK CHARTING
Evening Star Patterns In Light Crude?
03/05/09 02:16:42 PMby Chaitali Mohile
The Light-Crude Oil Index is likely to lose its past week's gains under the bearish shadows.
Position: N/A
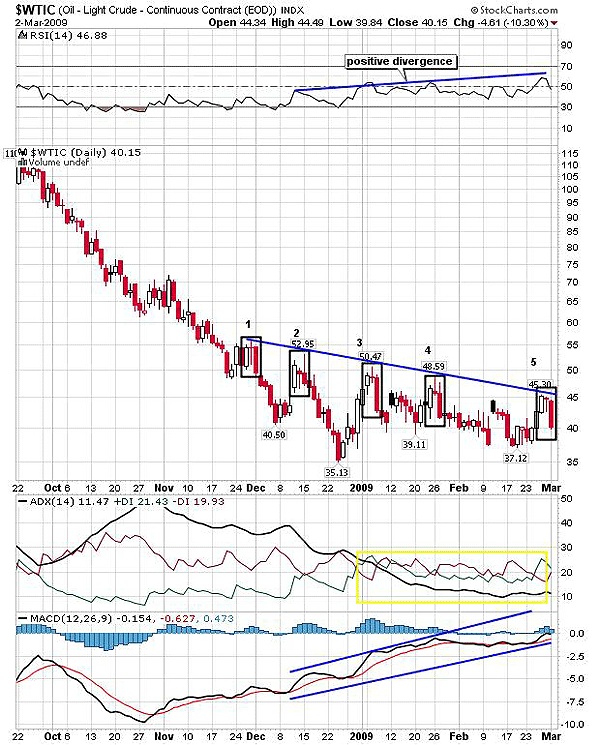
| The Oil-Light Crude Continuous Contract Index ($WTIC) has formed lower highs. The lower high formation indicates weakness prevailing in the stock/index. In Figure 1, $WTIC formed lower peaks, and at every peak we can see an evening-star candlestick pattern. The lowering trendline shows the declining tops and the boxes show the candlestick pattern. Among the first four boxes, 1, 3, and 4 are the evening-star candlestick patterns. This pattern is a bearish reversal, suggesting downside rally. Figure 1 shows the descending rally after the bearish candlestick pattern. The index had deep cuts of about 10/15 points from every lower top. But the rally following box 2 is the deepest. |
| The candlestick pattern in box 2 is not the evening star. Instead, we can see two different single candlestick patterns. The first candle is completely bullish, the second candle in the box resembles a hanging man with a small upper shadow, and the third looks like a shooting star (see Figure 1). Both the patterns are bearish reversals. As a result, $WTIC witnessed a robust bearish rally of 23 points approximately. Therefore, the lower tops and the bearish candlestick formations together have strengthened the bearish hold on the index. But the relative strength index (RSI)(14) and the moving average convergence/divergence (MACD)(12,26,9) in Figure 1 reflected the different story. |

|
| FIGURE 1: $WTIC, DAILY. The boxes shows candlestick formations and the declining trendlines indicate lower highs. The evening star candlestick patterns are marked in boxes 1, 3, 4, and 5. |
| Graphic provided by: StockCharts.com. |
| |
| The RSI (14) and the MACD (12,2,9) are indicating positive divergence toward the declining price rally. This divergence gave birth to the three-day bullish rally in the last week. Since early 2009, the average directional movement index (ADX)(14) has been descending below the 15 levels. The positive directional index (+DI) and the negative directional (-DI) have converged, indicating volatile consolidation. But due to the weak trend indicated by ADX (14) the bullish rally failed to surge. Currently, $WTIC is forming another evening star bearish reversal candlestick pattern (see box 5 in Figure 1). The RSI (14) is ready to drift below the 50 levels, and the MACD (12,26,9) is reluctant to move into positive territory. This suggested the lack of bullish strength. So the series of evening-star candlesticks supported by diminishing bullish strength would drag the index to the previous lows of $37 and $35. |

|
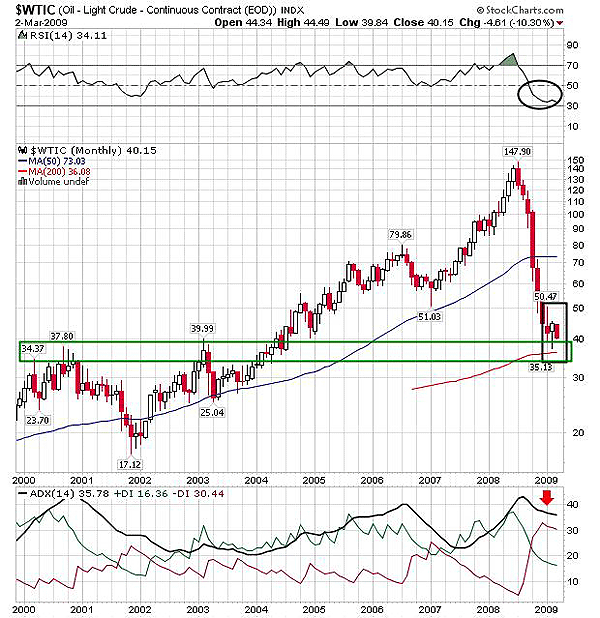
| FIGURE 2: $WTIC, MONTHLY. The index is heading toward the strong support zone. |
| Graphic provided by: StockCharts.com. |
| |
| Figure 2 shows the robust support zone for $WTIC. Apart from the previous highs that are currently strong support areas, the 200-day moving average (MA) is the additional support for the descending rally. The long-term trend indicated by the ADX (14) is down. Though the indicator has declined from the highly overheated levels, the trend currently is well developed and robustly bearish. The RSI (14) is still not oversold, but the support level at 30 may be challenged. The long-term indicators show more space for a downside rally. |
| Therefore, $WTIC may retrace back to the previous lows and subtract the minor gains on the relief rally. |
Active trader in the Indian stock markets since 2003 and a full-time writer. Trading is largely based upon technical analysis.
| Company: | Independent |
| Address: | C1/3 Parth Indraprasth Towers. Vastrapur |
| Ahmedabad, Guj 380015 | |
| E-mail address: | chaitalimohile@yahoo.co.in |
Traders' Resource Links | |
| Independent has not added any product or service information to TRADERS' RESOURCE. | |
Click here for more information about our publications!
Comments
Date: 03/10/09Rank: 3Comment:

Request Information From Our Sponsors
- VectorVest, Inc.
- Executive Premier Workshop
- One-Day Options Course
- OptionsPro
- Retirement Income Workshop
- Sure-Fire Trading Systems (VectorVest, Inc.)
- Trading as a Business Workshop
- VectorVest 7 EOD
- VectorVest 7 RealTime/IntraDay
- VectorVest AutoTester
- VectorVest Educational Services
- VectorVest OnLine
- VectorVest Options Analyzer
- VectorVest ProGraphics v6.0
- VectorVest ProTrader 7
- VectorVest RealTime Derby Tool
- VectorVest Simulator
- VectorVest Variator
- VectorVest Watchdog
- StockCharts.com, Inc.
- Candle Patterns
- Candlestick Charting Explained
- Intermarket Technical Analysis
- John Murphy on Chart Analysis
- John Murphy's Chart Pattern Recognition
- John Murphy's Market Message
- MurphyExplainsMarketAnalysis-Intermarket Analysis
- MurphyExplainsMarketAnalysis-Visual Analysis
- StockCharts.com
- Technical Analysis of the Financial Markets
- The Visual Investor
