HOT TOPICS LIST
- MACD
- Fibonacci
- RSI
- Gann
- ADXR
- Stochastics
- Volume
- Triangles
- Futures
- Cycles
- Volatility
- ZIGZAG
- MESA
- Retracement
- Aroon
INDICATORS LIST
LIST OF TOPICS
PRINT THIS ARTICLE
by Donald W. Pendergast, Jr.
Is the broad US market in a free fall, or are there some indications that a major low may be approaching?
Position: N/A
Donald W. Pendergast, Jr.
Donald W. Pendergast is a financial markets consultant who offers specialized services to stock brokers and high net worth individuals who seek a better bottom line for their portfolios.
PRINT THIS ARTICLE
TECHNICAL ANALYSIS
A Major Low Soon For Altria And The .NYA?
03/05/09 01:32:16 PMby Donald W. Pendergast, Jr.
Is the broad US market in a free fall, or are there some indications that a major low may be approaching?
Position: N/A
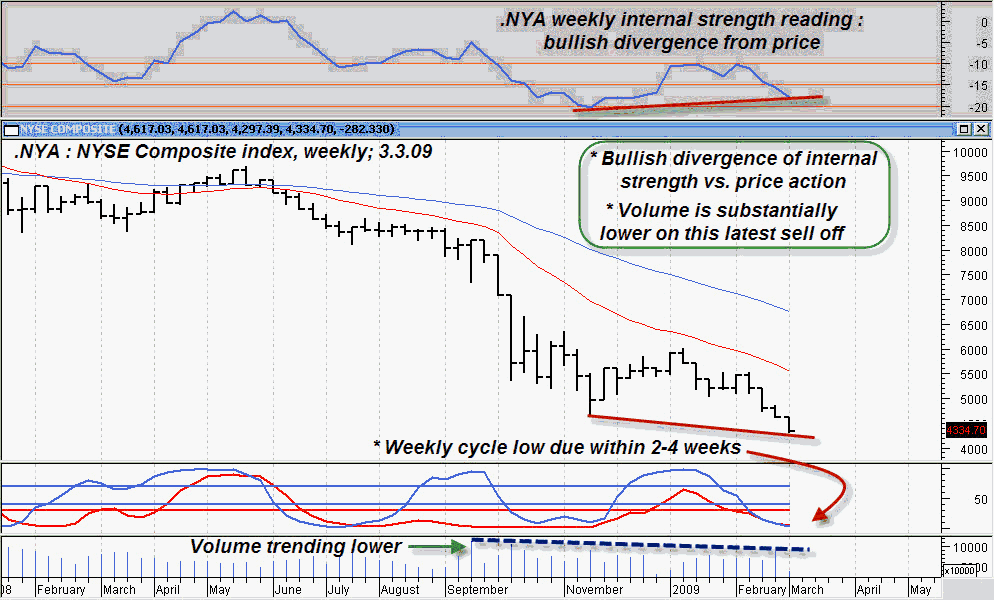
| The recent breakdown through the November 2008 lows has caught the attention of traders and investors of every persuasion. While the Dow Jones Industrial Average's (DJIA) plunge below 7000 isn't good news, a closer look at the internal strength readings of the New York Composite Index may be enough to provide a few glimmers of hope that the long-awaited "major low" may be coming -- and soon. The weekly chart of the .NYA is our first stop in our search for clues. |

|
| FIGURE 1: NYA, WEEKLY. An approaching cycle low, declining volume trend, and slightly bullish internal strength divergence may be suggesting a major low could be a possibility in the next few weeks. |
| Graphic provided by: MetaStock. |
| Graphic provided by: WB indicators from ProfitTrader for MetaStock. |
| |
| While the trend is still down, and long stock positions should generally be avoided right now, the internal strength indicator (a weighted mix of the advance-decline line, the ratio of new highs-new lows, the rate of change in price and the up volume-down volume ratio) is substantially higher than it was at the November 2008 lows. Technically, this is known as a nonconformation and may be viewed as a potential warning that the downtrend may be losing steam. Adding some extra power to this view is the fact that the weekly volume trend has been gradually declining for more than three months, another sign that the worst of the panic selling phase may be over for now. Although price cycle measurements can be a subjective form of technical analysis, the Standard & Poor's 500, the DJIA, and the .NYA all tend to feature a 20-week (average) period between cycle lows. If the cycle remains on schedule, we may witness the next major weekly low within two to four weeks. Given the other technicals, there may be some reason to believe that the broad US indexes may be within reach of the elusive major low that everyone has been hoping and praying for. Let's look at another big S&P 500 component stock, Altria Group (MO), and see if its weekly chart is also suggesting that institutional money has begun to flow into some of these beaten-down mega-cap stocks. |

|
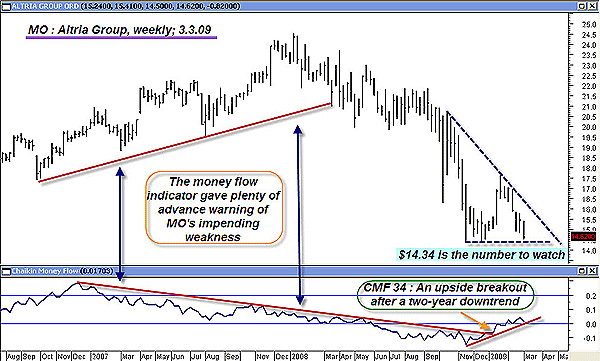
| FIGURE 2: MO, WEEKLY. Altria Group's Chaikin money flow (34) breakout appears significant, given the duration and intensity of the previous long-term money flow trend. |
| Graphic provided by: MetaStock. |
| |
| Interestingly, Altria Group is also displaying very positive money flow action; it recently broke out of a two-year long Chaikin money flow (34) downtrend, and has even moved smartly above its zero line. This is a positive confirmation that there is renewed interest in this high-yielding (8.3%) S&P 500 component stock. Just as with the .NYA, look at how much stronger the money flow reading is now than it was at the November 2008 lows, even though price is only marginally higher. The "line in the sand" is now $14.34 in this stock; a break lower is probably an indication of further weakness, but if the November low holds and the CMF (34) stays strong, MO might be one of the early "recoverees" in this bear market bloodbath. Of course, the .NYA, DJIA, and S&P 500 all need to put in major lows too, for the balance of the market to regain its footing. For those unsure as to how effective money flow analysis really is, I direct your attention to the left side of the Altria chart; note how the CMF (34) grew progressively weaker, even as the stock kept grinding higher. This was a visual display of the market phenomenon known as distribution. What that means is the smart money (pro traders and institutions)was gradually selling their positions to starry-eyed, profit-hungry, novice traders -- the ones so sure that MO was destined for even higher prices. Whenever you see such a pronounced divergence between long-term money flows and price action, you can be pretty sure that the pros are either selling into strength or buying into weakness. I suspect that right now, the latter scenario is the correct assumption. Maybe the rest of us can learn something from this, too, such as, "Dumb money chases price while smart money sells into strength." The converse is also true, too -- "smart money buys into weakness (if the underlying fundamentals are solid) while dumb money sells into weakness." |
| There should be some incredible moves -- either up or down -- in the next few weeks, so keep close tabs on your investment and trading positions. The weekly price action in .NYA and MO may also be a good idea to watch, too. |
Donald W. Pendergast is a financial markets consultant who offers specialized services to stock brokers and high net worth individuals who seek a better bottom line for their portfolios.
| Title: | Writer, market consultant |
| Company: | Linear Trading Systems LLC |
| Jacksonville, FL 32217 | |
| Phone # for sales: | 904-239-9564 |
| E-mail address: | lineartradingsys@gmail.com |
Traders' Resource Links | |
| Linear Trading Systems LLC has not added any product or service information to TRADERS' RESOURCE. | |
Click here for more information about our publications!
Comments
Date: 03/10/09Rank: 4Comment:

Request Information From Our Sponsors
- StockCharts.com, Inc.
- Candle Patterns
- Candlestick Charting Explained
- Intermarket Technical Analysis
- John Murphy on Chart Analysis
- John Murphy's Chart Pattern Recognition
- John Murphy's Market Message
- MurphyExplainsMarketAnalysis-Intermarket Analysis
- MurphyExplainsMarketAnalysis-Visual Analysis
- StockCharts.com
- Technical Analysis of the Financial Markets
- The Visual Investor
- VectorVest, Inc.
- Executive Premier Workshop
- One-Day Options Course
- OptionsPro
- Retirement Income Workshop
- Sure-Fire Trading Systems (VectorVest, Inc.)
- Trading as a Business Workshop
- VectorVest 7 EOD
- VectorVest 7 RealTime/IntraDay
- VectorVest AutoTester
- VectorVest Educational Services
- VectorVest OnLine
- VectorVest Options Analyzer
- VectorVest ProGraphics v6.0
- VectorVest ProTrader 7
- VectorVest RealTime Derby Tool
- VectorVest Simulator
- VectorVest Variator
- VectorVest Watchdog
