HOT TOPICS LIST
- MACD
- Fibonacci
- RSI
- Gann
- ADXR
- Stochastics
- Volume
- Triangles
- Futures
- Cycles
- Volatility
- ZIGZAG
- MESA
- Retracement
- Aroon
INDICATORS LIST
LIST OF TOPICS
PRINT THIS ARTICLE
by Mike Carr, CMT
Technical patterns indicate the next 1,000 points on the Dow Jones Industrial Average is more likely to be down than up.
Position: N/A
Mike Carr, CMT
Mike Carr, CMT, is a member of the Market Technicians Association, and editor of the MTA's newsletter, Technically Speaking. He is also the author of "Smarter Investing in Any Economy: The Definitive Guide to Relative Strength Investing," and "Conquering the Divide: How to Use Economic Indicators to Catch Stock Market Trends."
PRINT THIS ARTICLE
CHART ANALYSIS
Dow 6000?
03/02/09 09:25:17 AMby Mike Carr, CMT
Technical patterns indicate the next 1,000 points on the Dow Jones Industrial Average is more likely to be down than up.
Position: N/A
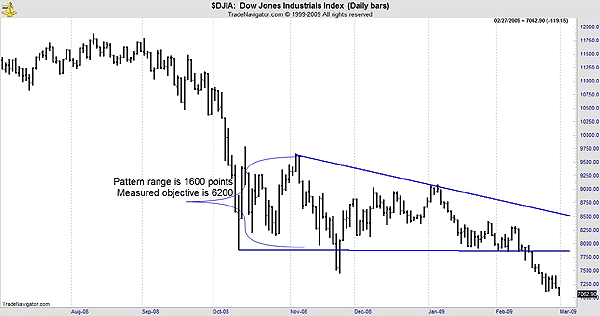
| The Dow Jones Industrial Average (DJIA) has just broken long-term support, down from a descending triangle (Figure 1). |

|
| FIGURE 1: DJIA, WEEKLY. The chart shows the triangle that formed since October 2008. |
| Graphic provided by: Trade Navigator. |
| |
| A descending triangle is a bearish chart pattern formed when a trendline connecting a series of lower highs and a second trendline that shows a strong level of support converge. On a break of the support, further downside is expected. Patterns provide measurement objective based upon the idea that symmetry exists in the markets. In the case of a triangle, the objective is assumed to be the same as the widest point in the pattern. |
| According to research done by Thomas Bulkowski, author of Encyclopedia Of Chart Patterns, this type of breakout ranks 10 out of the 21 patterns he tested. About half of the time the pattern objective is reached. |
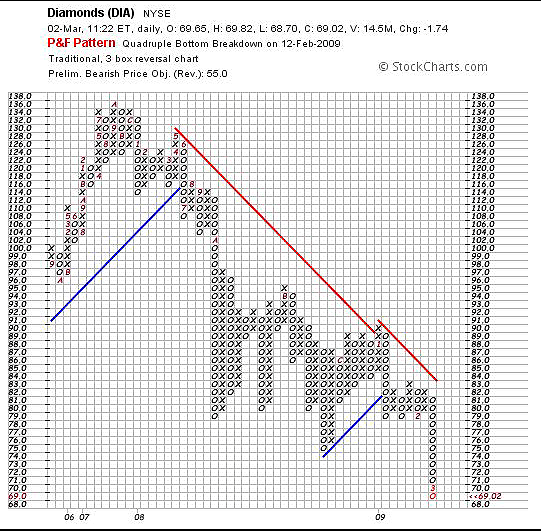
| In this case, we have a price target of 6200 for the DJIA. Support for this target is found in the point & figure chart. These charts plot only price, ignoring the passage of time, which allows for a clearer picture of the price trend. The P&F chart of the Diamonds exchange traded funds (ETF), a proxy for the DJIA, can be seen in Figure 2. |

|
| FIGURE 2: P&F, DIA. The P&F count supports the descending triangle objective, adding confidence to the analysis. |
| Graphic provided by: StockCharts.com. |
| |
| By taking a count of the number of boxes across the base that the stock has completed, we can determine an objective from the breakout. In this case, we find a base of seven boxes at the price level of 81. We multiply that number by 3, which is the size of the reversal required to switch columns from X to O and find that the expected move is 21 points from the breakout. The sell signal occurred at 78, and subtracting 21 from that offers a price target of 57. These two methods indicate that the DJIA may fall as low as 6000. There are bullish arguments to counter that, of course, but until the market moves back above 7900, the bears are in control. |
Mike Carr, CMT, is a member of the Market Technicians Association, and editor of the MTA's newsletter, Technically Speaking. He is also the author of "Smarter Investing in Any Economy: The Definitive Guide to Relative Strength Investing," and "Conquering the Divide: How to Use Economic Indicators to Catch Stock Market Trends."
| Website: | www.moneynews.com/blogs/MichaelCarr/id-73 |
| E-mail address: | marketstrategist@gmail.com |
Click here for more information about our publications!
Comments
Date: 03/03/09Rank: 4Comment:
Date: 03/03/09Rank: 4Comment:

Request Information From Our Sponsors
- StockCharts.com, Inc.
- Candle Patterns
- Candlestick Charting Explained
- Intermarket Technical Analysis
- John Murphy on Chart Analysis
- John Murphy's Chart Pattern Recognition
- John Murphy's Market Message
- MurphyExplainsMarketAnalysis-Intermarket Analysis
- MurphyExplainsMarketAnalysis-Visual Analysis
- StockCharts.com
- Technical Analysis of the Financial Markets
- The Visual Investor
- VectorVest, Inc.
- Executive Premier Workshop
- One-Day Options Course
- OptionsPro
- Retirement Income Workshop
- Sure-Fire Trading Systems (VectorVest, Inc.)
- Trading as a Business Workshop
- VectorVest 7 EOD
- VectorVest 7 RealTime/IntraDay
- VectorVest AutoTester
- VectorVest Educational Services
- VectorVest OnLine
- VectorVest Options Analyzer
- VectorVest ProGraphics v6.0
- VectorVest ProTrader 7
- VectorVest RealTime Derby Tool
- VectorVest Simulator
- VectorVest Variator
- VectorVest Watchdog
