HOT TOPICS LIST
- MACD
- Fibonacci
- RSI
- Gann
- ADXR
- Stochastics
- Volume
- Triangles
- Futures
- Cycles
- Volatility
- ZIGZAG
- MESA
- Retracement
- Aroon
INDICATORS LIST
LIST OF TOPICS
PRINT THIS ARTICLE
by Donald W. Pendergast, Jr.
Comparing the track records of the Fidelity Select Sector funds on a short-, intermediate-, and long-term basis may help identify industry group rotations.
Position: N/A
Donald W. Pendergast, Jr.
Donald W. Pendergast is a financial markets consultant who offers specialized services to stock brokers and high net worth individuals who seek a better bottom line for their portfolios.
PRINT THIS ARTICLE
REL. STR COMPARATIVE
Fidelity Sector Funds Leaders And Laggards
02/27/09 01:31:26 PMby Donald W. Pendergast, Jr.
Comparing the track records of the Fidelity Select Sector funds on a short-, intermediate-, and long-term basis may help identify industry group rotations.
Position: N/A
| Fidelity offers one of the most comprehensive array of sector funds; these 42 funds cover all of the key sectors and industry groups in the broad US markets. Although not as flexible to use as comparable exchange traded funds (ETFs) (no shorting available and only end of day trading permitted), for longer-term traders and investors, they remain a popular means of latching onto the strong trending moves that result as vast amounts of institutional money hurtle though the markets, seeking out the sectors with the best chances of long-term growth. While a discussion of all of the various ways to effectively trade Fidelity Select Sector funds isn't possible here, there are a few basic ways to determine which sector funds are strengthening or weakening on both a short-term and a long-term basis. We'll examine a simple price comparison method here, one that measures the percentage increase/decrease in a fund's price on a one-, five-, 10-, 20-, 30-, 60-, 120-, and 240-trading day basis, complete with the appropriate MetaStock exploration code to enable you to determine which sector funds are likely to be favorable places to deploy your investment capital. |

|
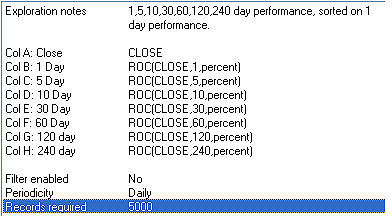
| FIGURE 1: SECTOR FUNDS PERFORMANCE. Tracking the performance of sector funds on a short-, intermediate-, and long-term basis may prove useful in spotting sector rotations and trend persistence. |
| Graphic provided by: MetaStock. |
| |
| In MetaStock's Explorer, create the following exploration (same as in Figure 1): Name: Fidelity Daily Performance Exploration notes: One-, five-, 10-, 30-, 60-, 120-, 240-day performance, sorted on one-day performance. For those with MetaStock, entering the exploration code (in the graphic) should be second nature by now; the leftmost text indicates the name of each particular column that will be displayed atop the exploration output, while the capital-lettered text on the right side is the actual code to be pasted into the formula box for each column. No filter is used. Now, paste each line of the code into its appropriate formula box in Explorer. Under "Options," make sure you select "Most recent date" and "Daily" under "Exploration Periodicity." Click OK when you've done that, highlight the new exploration you just created, hit Explore and then load your list of Fidelity Select Sector mutual funds. Hit OK, let it rip through all the data (takes about two seconds) and then click Reports to bring up the same exploration output grids shown in Figure 2. The idea of the exploration is to track the long- and short-term rotation of the funds, paying particularly close attention to those funds that are exhibiting strength across a range of time frames as well as those that are manifesting weakness across multiple time frames. Once you've identified the persistently strong and weak funds, you may be better able to make wise decisions as to which funds you want to deploy cash into. Another way to use this information is to find the strongest funds (particularly those with the strongest 240-day reading, which covers about a year's worth of market action) and then drill down to the component stocks within those funds (Fidelity posts partial listings of each sector fund's holdings on their website), looking for key support/resistance levels and/or pullbacks in a strong trend that may provide low-risk entry points. For the bottom fishers of the world, daily monitoring of the weakest sector funds could also prove beneficial, particularly when the broad markets are showing signs of major downside exhaustion. Some sector fund analysts have posited that most sectors hit bottom two to three years after crashing from substantially higher levels, and that these devastated sectors (if down 70% to 90%) can frequently turn into the next market cycle's outperformers. Consistent monitoring of the sector funds on a regular basis should prove useful to a variety of traders and investors. |

|
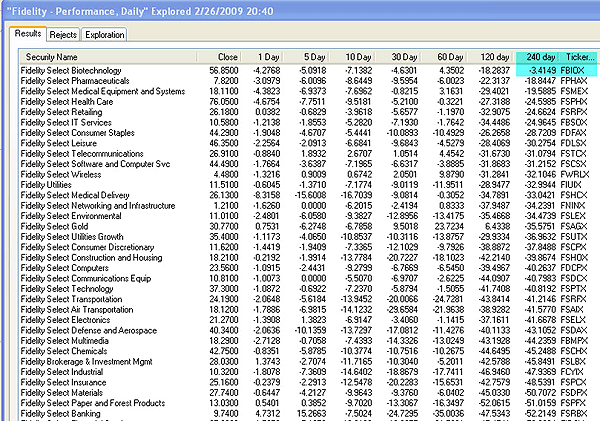
| FIGURE 2: FBIOX, DAILY. Any mutual fund that's down by only 3.4% in the past 12 months must certainly qualify for the term "survivor." |
| Graphic provided by: MetaStock. |
| |
| Figure 2 displays today's' results on all 42 Fidelity Select Sector funds. Fidelity Select Biotechnology (FBIOX) has had the best 240-day performance, only down by -3.41%, no small feat given the devastating bear market since late 2007. We also note that although FBIOX is down by -18.28% during the past 120 trading days, its one-, five-, 10-, 20-, 30-, and 60-day performance has been relatively flat to slightly down. In fact, just by glancing at the performance figures for trading periods 1-30, a trader could determine that FBIOX was either in a period of consolidation and/or a very weak trend, which indeed happens to be the case. |

|
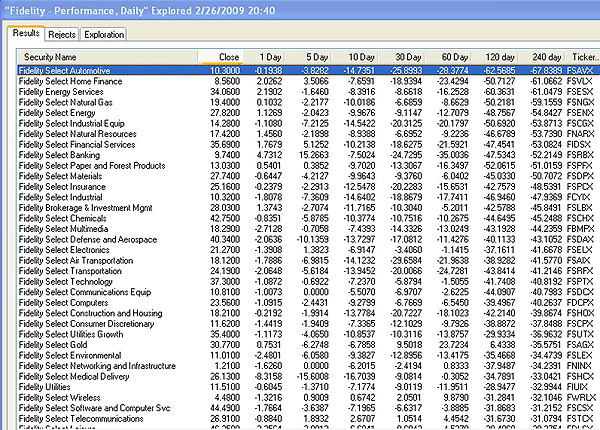
| FIGURE 3: FSAVX, FSVLX, DAILY. Conversely, FSAVX has the worst overall persistence of trend of any Fidelity Select Sector fund, down significantly in each column. Fidelity Select Home Finance (FSVLX) comes in a close second in terms of overall weakness. |
| Graphic provided by: MetaStock. |
| |
| Now let's examine the worst performing sector fund over the past 240 trading days -- Fidelity Select Automotive (FSAVX). Down a mind-shattering -67.84%-, this fund is also the weakest in the 120-, 60-, and 30-day columns as well. Incredibly, this fund is also in the red in the shorter-term one-, five-, 10-, and 20-day columns, too. At first glance this fund might appear like a potential buy from a bottom-fisher's point of view, but extreme caution is warranted since the broad markets still have not made a confirmed low yet. If we do see that major low confirmed, then prudent investors might want to deploy a small amount of cash into either FSAVX or the most recently listed component stocks within, names like Johnson Controls (JCI), Ford (F), and Goodyear Tire and Rubber (GT). In the meantime, shorting such component stocks on bear market rallies might be the sanest way to engage the heavily wounded automotive sector until the broad markets finally sound the all-clear signal that so many burned traders and investors are longing for. |
| Whether you prefer sector mutual funds or ETFs, the fact remains that identifying sector rotation and relative strength can add an edge to those traders seeking to deploy funds on the right side of any given market. Spend some time with the exploration presented in this article and see if it doesn't shed some light on the origin of the powerful trend moves we see in the various industry groups. |
Donald W. Pendergast is a financial markets consultant who offers specialized services to stock brokers and high net worth individuals who seek a better bottom line for their portfolios.
| Title: | Writer, market consultant |
| Company: | Linear Trading Systems LLC |
| Jacksonville, FL 32217 | |
| Phone # for sales: | 904-239-9564 |
| E-mail address: | lineartradingsys@gmail.com |
Traders' Resource Links | |
| Linear Trading Systems LLC has not added any product or service information to TRADERS' RESOURCE. | |
Click here for more information about our publications!
Comments

Request Information From Our Sponsors
- StockCharts.com, Inc.
- Candle Patterns
- Candlestick Charting Explained
- Intermarket Technical Analysis
- John Murphy on Chart Analysis
- John Murphy's Chart Pattern Recognition
- John Murphy's Market Message
- MurphyExplainsMarketAnalysis-Intermarket Analysis
- MurphyExplainsMarketAnalysis-Visual Analysis
- StockCharts.com
- Technical Analysis of the Financial Markets
- The Visual Investor
- VectorVest, Inc.
- Executive Premier Workshop
- One-Day Options Course
- OptionsPro
- Retirement Income Workshop
- Sure-Fire Trading Systems (VectorVest, Inc.)
- Trading as a Business Workshop
- VectorVest 7 EOD
- VectorVest 7 RealTime/IntraDay
- VectorVest AutoTester
- VectorVest Educational Services
- VectorVest OnLine
- VectorVest Options Analyzer
- VectorVest ProGraphics v6.0
- VectorVest ProTrader 7
- VectorVest RealTime Derby Tool
- VectorVest Simulator
- VectorVest Variator
- VectorVest Watchdog
