HOT TOPICS LIST
- MACD
- Fibonacci
- RSI
- Gann
- ADXR
- Stochastics
- Volume
- Triangles
- Futures
- Cycles
- Volatility
- ZIGZAG
- MESA
- Retracement
- Aroon
INDICATORS LIST
LIST OF TOPICS
PRINT THIS ARTICLE
by Koos van der Merwe
One of the three finalists of the CNBC Million Dollar trading competition was a contrarian.
Position: Accumulate
Koos van der Merwe
Has been a technical analyst since 1969, and has worked as a futures and options trader with First Financial Futures in Johannesburg, South Africa.
PRINT THIS ARTICLE
Being A Contrarian
02/27/09 01:25:20 PMby Koos van der Merwe
One of the three finalists of the CNBC Million Dollar trading competition was a contrarian.
Position: Accumulate
| Wikipedia defines an investing contrarian as follows. In finance, a contrarian is one who attempts to profit by investing in a manner that differs from the conventional wisdom, when the consensus opinion appears to be wrong. A contrarian believes that certain crowd behavior among investors can lead to exploitable mispricings in securities markets. For example, widespread pessimism about a stock can drive a price so low that it overstates the company's risks and understates its prospects for returning to profitability. Identifying and purchasing such distressed stocks, and selling them after the company recovers, can lead to above-average gains. When asked how she made her choice of what to buy that led her to placing third in the competition, the contrarian competitor replied, "I felt that financial shares were oversold, so I decided to do the opposite, and buy them. I think I was lucky." Without knowing it, she was a contrarian. The woman who came second also bought financial stocks, and the winner, a young man, did not trade stocks at all. His win came from a bet on a currency play. |

|
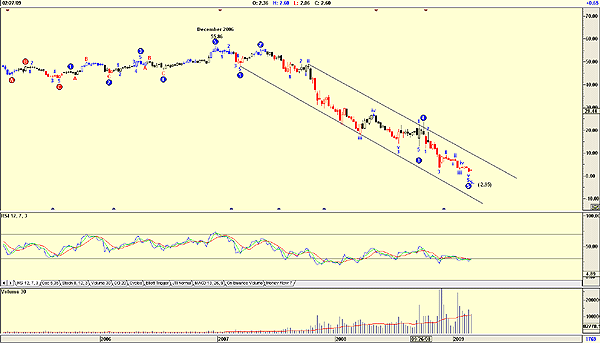
| FIGURE 1: CITIGROUP, WEEKLY |
| Graphic provided by: AdvancedGET. |
| |
| So is being a contrarian the way to go? Should we start buying financial stocks and hope to get lucky? Figure 1 is a weekly chart of CitiGroup, a bank that could be nationalized in the very near future. The chart shows how the price has fallen from a high of $55.86 in December 2006 to the present low of $2.06 with an Elliott wave projection of $-2.95, which could occur if the stock is delisted for any reason. Would you buy it? No, but a contrarian would, simply because everyone else is selling. Never forget, for every seller there must be a buyer. Note how volume increased strongly as the price fell, showing weakness. |

|
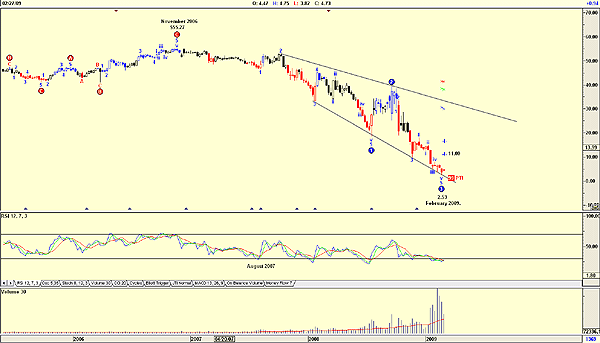
| FIGURE 2: BANK OF AMERICA, WEEKLY |
| Graphic provided by: AdvancedGET. |
| |
| Figure 2 is a weekly chart of Bank of America. Note how the price of the share fell from a high of $55.27 in November 2006 to its present low of $2.53. Also note, however, that over the last two weeks, volume has fallen as the price fell, suggesting strength. The relative strength index (RSI) has been oversold and giving buy signals since August 2007, ending up totally ineffective. The chart does, however, show expanding support and resistance trendlines, which suggests uncertainty. The Advanced GET Elliott wave count is suggesting that there is a 99% probability of a rise in a fourth-wave correction to $11.00. Would you buy the share based on these signals? No, but a contrarian would, and does. |

|
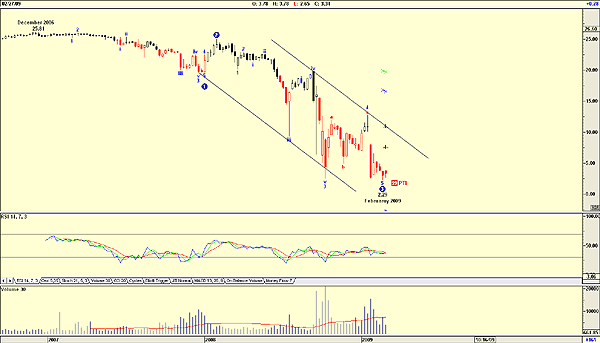
| FIGURE 3: ROYAL BANK OF SCOTLAND, PREFERRED M, WEEKLY |
| Graphic provided by: AdvancedGET. |
| |
| Figure 3 is also a financial stock, but a preferred share and of a bank that is 70% owned by its government, but has not been nationalized, at least not yet. The stock is Royal Bank of Scotland Preferred Series M, which trades on the New York Stock Exchange as an American Depository Receipt (ADR). The weekly chart shows how the price fell from a high of $25.81 in December 2006 to its present low of $2.29. Once again, the RSI has suggested buys that never materialized, and once again volume is falling as the price falls, suggesting strength. I mention RBS Pref M as an example because at the moment, the yield is 51%. The risk of course is that the bank could default on paying the dividend. |
| So what is it that attracts a buyer everytime there is a seller in a falling share price? The attraction is the belief that prices are mispriced -- that a share has been oversold as sellers sell at any price just to be rid of it. To be a contrarian can be exceptionally profitable, as shown by two of the three finalists in the CNBC competition, but it does come with a great deal of risk -- but being a contrarian can be exceedingly profitable. |
Has been a technical analyst since 1969, and has worked as a futures and options trader with First Financial Futures in Johannesburg, South Africa.
| Address: | 3256 West 24th Ave |
| Vancouver, BC | |
| Phone # for sales: | 6042634214 |
| E-mail address: | petroosp@gmail.com |
Click here for more information about our publications!
Comments
Date: 03/03/09Rank: 3Comment:

Request Information From Our Sponsors
- StockCharts.com, Inc.
- Candle Patterns
- Candlestick Charting Explained
- Intermarket Technical Analysis
- John Murphy on Chart Analysis
- John Murphy's Chart Pattern Recognition
- John Murphy's Market Message
- MurphyExplainsMarketAnalysis-Intermarket Analysis
- MurphyExplainsMarketAnalysis-Visual Analysis
- StockCharts.com
- Technical Analysis of the Financial Markets
- The Visual Investor
- VectorVest, Inc.
- Executive Premier Workshop
- One-Day Options Course
- OptionsPro
- Retirement Income Workshop
- Sure-Fire Trading Systems (VectorVest, Inc.)
- Trading as a Business Workshop
- VectorVest 7 EOD
- VectorVest 7 RealTime/IntraDay
- VectorVest AutoTester
- VectorVest Educational Services
- VectorVest OnLine
- VectorVest Options Analyzer
- VectorVest ProGraphics v6.0
- VectorVest ProTrader 7
- VectorVest RealTime Derby Tool
- VectorVest Simulator
- VectorVest Variator
- VectorVest Watchdog
