HOT TOPICS LIST
- MACD
- Fibonacci
- RSI
- Gann
- ADXR
- Stochastics
- Volume
- Triangles
- Futures
- Cycles
- Volatility
- ZIGZAG
- MESA
- Retracement
- Aroon
INDICATORS LIST
LIST OF TOPICS
PRINT THIS ARTICLE
by Mike Carr, CMT
As the market trades near key support, relative strength can show us where to look for potential winners if the market turns higher.
Position: N/A
Mike Carr, CMT
Mike Carr, CMT, is a member of the Market Technicians Association, and editor of the MTA's newsletter, Technically Speaking. He is also the author of "Smarter Investing in Any Economy: The Definitive Guide to Relative Strength Investing," and "Conquering the Divide: How to Use Economic Indicators to Catch Stock Market Trends."
PRINT THIS ARTICLE
REL. STR COMPARATIVE
Spotting Tomorrow's Leaders
02/27/09 01:16:58 PMby Mike Carr, CMT
As the market trades near key support, relative strength can show us where to look for potential winners if the market turns higher.
Position: N/A
| Countless academic studies have demonstrated that over the intermediate term, stocks trend. This means that the stocks that have gone up the most over the past three to six months are most likely to continue their winning ways in coming weeks. One way to measure past performance is to look at relative strength (RS). |
| The momentum of comparative strength (MoCS) indicator allows us to trade RS signals on an individual stock rather than using the more familiar portfolio rankings of RS. MoCS is a moving average convergence/divergence (MACD) calculation of the stock's performance compared to the Standard & Poor's 500. |
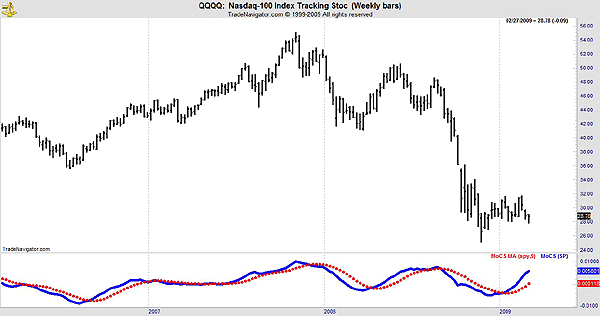
| Figure 1 shows the PowerShares QQQ (QQQQ) exchange traded fund (ETF), which tracks the NASDAQ 100. These are speculative stocks, and at past market bottoms, speculative stocks have tended to outperform value stocks. |

|
| FIGURE 1: QQQQ, WEEKLY. The RS is showing a strong buy signal despite the choppy price action since the November lows. |
| Graphic provided by: TradeNavigator. |
| |
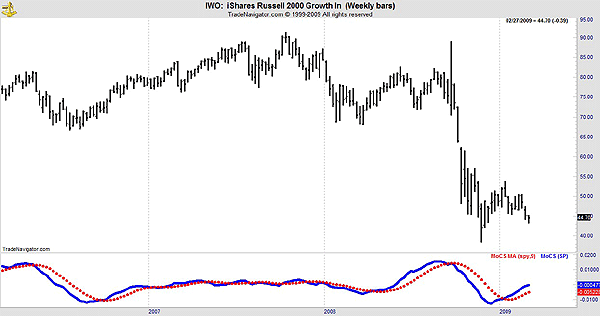
| This is confirmed by the small-cap indexes as well. The Russell 2000 Value Index (Figure 2) shows the same RS pattern as QQQQ. Although not shown, value stock indexes are on sell signals based on the MoCS. |

|
| FIGURE 2: IWO, WEEKLY. This chart confirms the strength of growth stocks in the first weeks of 2009. |
| Graphic provided by: TradeNavigator. |
| |
| Speculation is present when investors are optimismic and is a healthy sign in the stock market. The strength of growth stocks may be alerting traders to a bottom in the current, somewhat scary, market. |
Mike Carr, CMT, is a member of the Market Technicians Association, and editor of the MTA's newsletter, Technically Speaking. He is also the author of "Smarter Investing in Any Economy: The Definitive Guide to Relative Strength Investing," and "Conquering the Divide: How to Use Economic Indicators to Catch Stock Market Trends."
| Website: | www.moneynews.com/blogs/MichaelCarr/id-73 |
| E-mail address: | marketstrategist@gmail.com |
Click here for more information about our publications!
Comments
Date: 03/04/09Rank: 4Comment:
Date: 03/10/09Rank: 3Comment:

Request Information From Our Sponsors
- StockCharts.com, Inc.
- Candle Patterns
- Candlestick Charting Explained
- Intermarket Technical Analysis
- John Murphy on Chart Analysis
- John Murphy's Chart Pattern Recognition
- John Murphy's Market Message
- MurphyExplainsMarketAnalysis-Intermarket Analysis
- MurphyExplainsMarketAnalysis-Visual Analysis
- StockCharts.com
- Technical Analysis of the Financial Markets
- The Visual Investor
- VectorVest, Inc.
- Executive Premier Workshop
- One-Day Options Course
- OptionsPro
- Retirement Income Workshop
- Sure-Fire Trading Systems (VectorVest, Inc.)
- Trading as a Business Workshop
- VectorVest 7 EOD
- VectorVest 7 RealTime/IntraDay
- VectorVest AutoTester
- VectorVest Educational Services
- VectorVest OnLine
- VectorVest Options Analyzer
- VectorVest ProGraphics v6.0
- VectorVest ProTrader 7
- VectorVest RealTime Derby Tool
- VectorVest Simulator
- VectorVest Variator
- VectorVest Watchdog
