HOT TOPICS LIST
- MACD
- Fibonacci
- RSI
- Gann
- ADXR
- Stochastics
- Volume
- Triangles
- Futures
- Cycles
- Volatility
- ZIGZAG
- MESA
- Retracement
- Aroon
INDICATORS LIST
LIST OF TOPICS
PRINT THIS ARTICLE
by James Kupfer
Shares of USO may be breaking out of a Fibonacci fan pattern.
Position: Hold
James Kupfer
Mr. Kupfer is a market professional and amateur stock market commentator. Disclosure: It is likely that Mr. Kupfer has or will enter a position in any security he writes about.
PRINT THIS ARTICLE
FAN LINES
Oil All Dried Up?
02/27/09 09:30:58 AMby James Kupfer
Shares of USO may be breaking out of a Fibonacci fan pattern.
Position: Hold
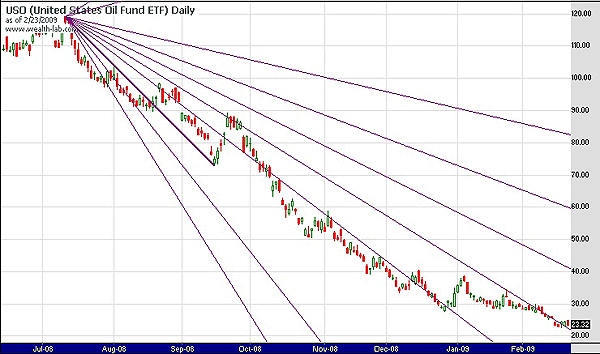
| Along with the global economy and perceived demand, shares of the oil tracking exchange traded fund (ETF), USO, have fallen precipitously since July 2008. The downward slope of the decline has been very steep indeed. Now, however, there is a glimmer of hope that USO may be starting to put in some type of bottom. |

|
| FIGURE 1: USO, DAILY. A Fibonacci fan shows the extreme downward movement of USO since the market peak. |
| Graphic provided by: Wealth-Lab. |
| |
| Looking at Figure 1, you can see that I have drawn a Fibonacci fan between the July 2008 top and the August 2008 reaction low. There are other obvious points that the Fibonacci fan could be drawn with that could well hold importance in the future, but seeing as how USO has stayed nicely below the fan, I think it is valid to ascribe importance to it at this time. On four instances, USO has tested the 38.2% Fibonacci level, only to turn back down. In only one period did USO manage to close above, albeit briefly, the Fibonacci level. |
| Now, however, USO has managed to close for three consecutive days above the fan line. Price movement over these days has been flat, but a close above the fan line, nonetheless. This signals a potential short- to intermediate-term bottom. Should we get a bounce here, it would likely be a very mild one, perhaps even move along the lines of a consolidation phase rather than an outright bounce. Keep in mind that this only signals a potential bounce; price movement to the upside is needed before we can say that the strong bear market in oil is ready for a rest. |
Mr. Kupfer is a market professional and amateur stock market commentator. Disclosure: It is likely that Mr. Kupfer has or will enter a position in any security he writes about.
Click here for more information about our publications!
Comments
Date: 03/03/09Rank: 3Comment:
Date: 03/04/09Rank: 4Comment:

Request Information From Our Sponsors
- VectorVest, Inc.
- Executive Premier Workshop
- One-Day Options Course
- OptionsPro
- Retirement Income Workshop
- Sure-Fire Trading Systems (VectorVest, Inc.)
- Trading as a Business Workshop
- VectorVest 7 EOD
- VectorVest 7 RealTime/IntraDay
- VectorVest AutoTester
- VectorVest Educational Services
- VectorVest OnLine
- VectorVest Options Analyzer
- VectorVest ProGraphics v6.0
- VectorVest ProTrader 7
- VectorVest RealTime Derby Tool
- VectorVest Simulator
- VectorVest Variator
- VectorVest Watchdog
- StockCharts.com, Inc.
- Candle Patterns
- Candlestick Charting Explained
- Intermarket Technical Analysis
- John Murphy on Chart Analysis
- John Murphy's Chart Pattern Recognition
- John Murphy's Market Message
- MurphyExplainsMarketAnalysis-Intermarket Analysis
- MurphyExplainsMarketAnalysis-Visual Analysis
- StockCharts.com
- Technical Analysis of the Financial Markets
- The Visual Investor
