HOT TOPICS LIST
- MACD
- Fibonacci
- RSI
- Gann
- ADXR
- Stochastics
- Volume
- Triangles
- Futures
- Cycles
- Volatility
- ZIGZAG
- MESA
- Retracement
- Aroon
INDICATORS LIST
LIST OF TOPICS
PRINT THIS ARTICLE
by Alan R. Northam
The Dow Jones Industrial Average has now moved below its November 2008 low. How low can the Dow go?
Position: N/A
Alan R. Northam
Alan Northam lives in the Dallas, Texas area and as an electronic engineer gave him an analytical mind from which he has developed a thorough knowledge of stock market technical analysis. His abilities to analyze the future direction of the stock market has allowed him to successfully trade of his own portfolio over the last 30 years. Mr. Northam is now retired and trading the stock market full time. You can reach him at inquiry@tradersclassroom.com or by visiting his website at http://www.tradersclassroom.com. You can also follow him on Twitter @TradersClassrm.
PRINT THIS ARTICLE
ELLIOTT WAVE
How Low Can The Dow Go?
02/27/09 12:50:27 PMby Alan R. Northam
The Dow Jones Industrial Average has now moved below its November 2008 low. How low can the Dow go?
Position: N/A
| On February 3, I wrote an article entitled "DJIA Resumes Downward Trend." On Friday, February 20, the Dow Jones Industrial Average (DJIA) made a new lower low price, confirming the downward trend. So how low can the Dow go? |
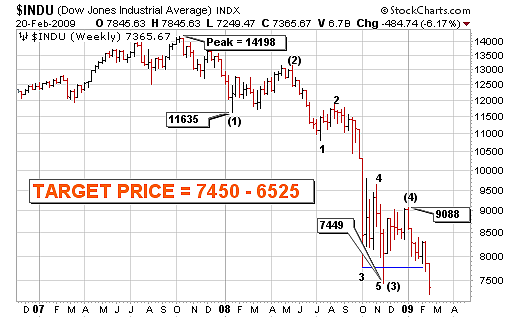
| In determining how low the DJIA can go, I find that the Elliott wave theory gives a very good indication of the price target for the completion of wave (5). The Elliott wave theory simply states that wave (5) is typically the same length of its wave (1). There are two ways to accomplish this: arithmetic and ratio. To determine a good price target for the completion of the downward trend for the DJIA arithmetically, we take 14,198 and subtract 11,635 from it and get the subtrahend (that is, the number to be subtracted) of 2563. We then take 2563 and subtract it from 9088 to get a price target of 6525. To determine the price target for the completion of wave (5) and the complete downward trend using ratios, we take 14,198 and divide it by 11,635 to get the quotient 1.22. This quotient is then divided into 9088 to arrive at a price target for the completion of wave (5) of 7450. |

|
| FIGURE 1: DJIA, WEEKLY. This chart shows the Elliott wave count and the target price range for the completion of the downtrend. |
| Graphic provided by: StockCharts.com. |
| |
| Combining these two different ways of calculating the completion of wave (5) and the complete move down from the October 2007 high, we arrive at a price target range of from 7450 to 6525. From the price chart, we can see that the DJIA entered into this price target range on Friday, February 20, when it made a new low price of 7249. (See Figure 1.) |
| In conclusion, the DJIA has now entered into the price target range where we expect the DJIA to complete wave (5) down. Therefore, it is time to start looking for signs of a trend reversal signal to develop that will inform us that the Dow is in the process of reversing its trend from down to up. |
Alan Northam lives in the Dallas, Texas area and as an electronic engineer gave him an analytical mind from which he has developed a thorough knowledge of stock market technical analysis. His abilities to analyze the future direction of the stock market has allowed him to successfully trade of his own portfolio over the last 30 years. Mr. Northam is now retired and trading the stock market full time. You can reach him at inquiry@tradersclassroom.com or by visiting his website at http://www.tradersclassroom.com. You can also follow him on Twitter @TradersClassrm.
| Garland, Tx | |
| Website: | www.tradersclassroom.com |
| E-mail address: | inquiry@tradersclassroom.com |
Click here for more information about our publications!
Comments
Date: 03/03/09Rank: 5Comment:

Request Information From Our Sponsors
- StockCharts.com, Inc.
- Candle Patterns
- Candlestick Charting Explained
- Intermarket Technical Analysis
- John Murphy on Chart Analysis
- John Murphy's Chart Pattern Recognition
- John Murphy's Market Message
- MurphyExplainsMarketAnalysis-Intermarket Analysis
- MurphyExplainsMarketAnalysis-Visual Analysis
- StockCharts.com
- Technical Analysis of the Financial Markets
- The Visual Investor
- VectorVest, Inc.
- Executive Premier Workshop
- One-Day Options Course
- OptionsPro
- Retirement Income Workshop
- Sure-Fire Trading Systems (VectorVest, Inc.)
- Trading as a Business Workshop
- VectorVest 7 EOD
- VectorVest 7 RealTime/IntraDay
- VectorVest AutoTester
- VectorVest Educational Services
- VectorVest OnLine
- VectorVest Options Analyzer
- VectorVest ProGraphics v6.0
- VectorVest ProTrader 7
- VectorVest RealTime Derby Tool
- VectorVest Simulator
- VectorVest Variator
- VectorVest Watchdog
