HOT TOPICS LIST
- MACD
- Fibonacci
- RSI
- Gann
- ADXR
- Stochastics
- Volume
- Triangles
- Futures
- Cycles
- Volatility
- ZIGZAG
- MESA
- Retracement
- Aroon
INDICATORS LIST
LIST OF TOPICS
PRINT THIS ARTICLE
by Chaitali Mohile
The reversal patterns are likely to drag down the Health Care Index to the immediate support level. Is the correction only a reaction to bearish formations?
Position: N/A
Chaitali Mohile
Active trader in the Indian stock markets since 2003 and a full-time writer. Trading is largely based upon technical analysis.
PRINT THIS ARTICLE
REVERSAL
Health Care Index Declines
02/26/09 09:49:39 AMby Chaitali Mohile
The reversal patterns are likely to drag down the Health Care Index to the immediate support level. Is the correction only a reaction to bearish formations?
Position: N/A
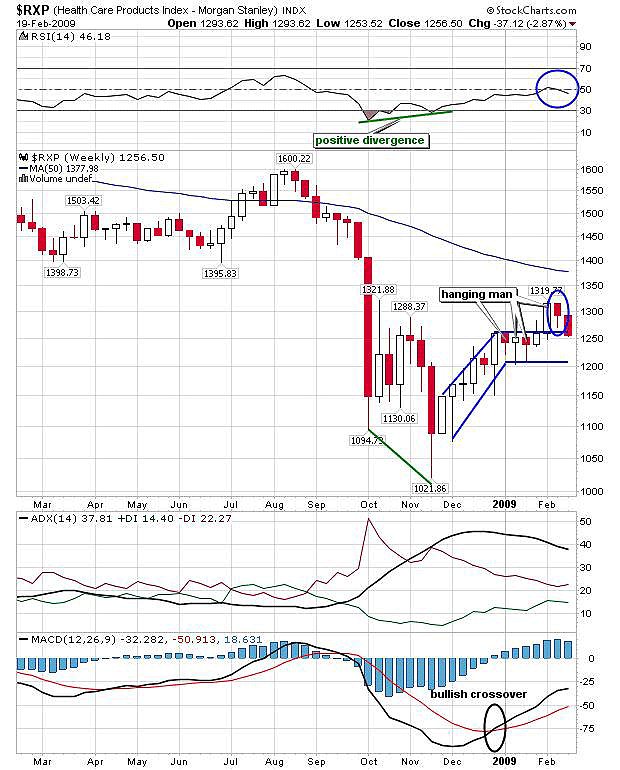
| The positive divergence on the relative strength index (RSI) (14) of the Health Care Product Index ($RXP) gave birth to a bullish rally. The average directional movement index (ADX) (14) in Figure 1 surged above 40 levels, indicating an overheated downtrend. And the bullish crossover of the moving average convergence/divergence (MACD) (12,26,9) strengthened the new upward move. $RXP witnessed a robust rally of about 150 points from 1100 to 1250 levels and entered a sideways consolidation period. But in Figure 1 we can see the consolidated move was not healthy as more than one hanging man candle appeared. The hanging man candlestick pattern indicated a reversal rally and reluctance in carrying the upward rally higher. |

|
| FIGURE 1: $RXP, WEEKLY. Here's the cluster of hanging man candlestick patterns. |
| Graphic provided by: StockCharts.com. |
| |
| However, $RXP broke upward on the weak candlestick pattern. The declining RSI (14) added the bearish pressure on the breakout. The RSI (14) indicated lack of strength to move the price rally higher (see the market circle in Figure 1). Currently, the ADX (14) is indicating a developing downtrend. For undergoing a bullish breakout rally in the downtrend, the stock/index requires robust strength and positive momentum. Figure 1 shows another hanging man formation after the bullish week. As a result, the index began descending. Currently, $RXP is near the breakout support. But the weak indicators suggested a further descent toward the next support at 1200 level. |

|
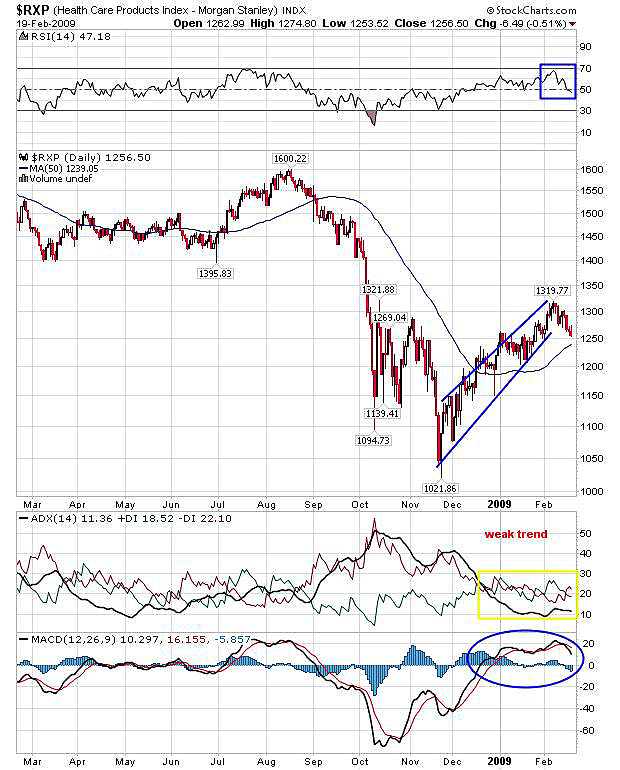
| FIGURE 2: $RXP, DAILY. The rising wedge has broken downward. The 50-day MA is the immediate support for the declining rally. |
| Graphic provided by: StockCharts.com. |
| |
| Figure 2 shows the rising wedge formation on the price chart. The rising wedge is a bearish reversal pattern that breaks in a downward direction. $RXP formed this pattern during the relief rally in a bear market. As seen in Figure 2, $RXP has already broken down. The RSI (14) has declined vertically and has marginally moved below 50 levels, suggesting a downside rally. The bearish crossover of MACD (12,26,9) in the positive territory and the weak ADX (14) would drag $RXP to the 50-day moving average (MA) support at 1239 level. |
| Thus, the current descent in $RXP is only the reaction of the bearish formations on the charts. But if the 50-day MA support is breached, the index would resume its downward journey as the main trend remained bearish. |
Active trader in the Indian stock markets since 2003 and a full-time writer. Trading is largely based upon technical analysis.
| Company: | Independent |
| Address: | C1/3 Parth Indraprasth Towers. Vastrapur |
| Ahmedabad, Guj 380015 | |
| E-mail address: | chaitalimohile@yahoo.co.in |
Traders' Resource Links | |
| Independent has not added any product or service information to TRADERS' RESOURCE. | |
Click here for more information about our publications!
Comments

Request Information From Our Sponsors
- StockCharts.com, Inc.
- Candle Patterns
- Candlestick Charting Explained
- Intermarket Technical Analysis
- John Murphy on Chart Analysis
- John Murphy's Chart Pattern Recognition
- John Murphy's Market Message
- MurphyExplainsMarketAnalysis-Intermarket Analysis
- MurphyExplainsMarketAnalysis-Visual Analysis
- StockCharts.com
- Technical Analysis of the Financial Markets
- The Visual Investor
- VectorVest, Inc.
- Executive Premier Workshop
- One-Day Options Course
- OptionsPro
- Retirement Income Workshop
- Sure-Fire Trading Systems (VectorVest, Inc.)
- Trading as a Business Workshop
- VectorVest 7 EOD
- VectorVest 7 RealTime/IntraDay
- VectorVest AutoTester
- VectorVest Educational Services
- VectorVest OnLine
- VectorVest Options Analyzer
- VectorVest ProGraphics v6.0
- VectorVest ProTrader 7
- VectorVest RealTime Derby Tool
- VectorVest Simulator
- VectorVest Variator
- VectorVest Watchdog
