HOT TOPICS LIST
- MACD
- Fibonacci
- RSI
- Gann
- ADXR
- Stochastics
- Volume
- Triangles
- Futures
- Cycles
- Volatility
- ZIGZAG
- MESA
- Retracement
- Aroon
INDICATORS LIST
LIST OF TOPICS
PRINT THIS ARTICLE
by Donald W. Pendergast, Jr.
Gold's corrective move may finally be over, and a bullish breakout from its weekly flag pattern may imply substantially higher prices.
Position: Hold
Donald W. Pendergast, Jr.
Donald W. Pendergast is a financial markets consultant who offers specialized services to stock brokers and high net worth individuals who seek a better bottom line for their portfolios.
PRINT THIS ARTICLE
FLAGS AND PENNANTS
Gold Breaking Out From Weekly Flag
02/26/09 09:41:20 AMby Donald W. Pendergast, Jr.
Gold's corrective move may finally be over, and a bullish breakout from its weekly flag pattern may imply substantially higher prices.
Position: Hold
| When gold finally topped $1,000 an ounce last March, some analysts within the gold bug community were making bold predictions including forecasts of $3,000 an ounce, and other kinds of weighty pronouncements that frequently coincide with a major monthly cycle high of a given stock, index, or commodity. Of course, since many analysts don't even consider the existence of price cycles, the ensuing collapse of gold back toward $680 came as a complete surprise to many otherwise talented market technicians and newsletter writers. Has the situation changed? Are we in for a repeat of the March 2008 scenario, in which we need to prepare for a sudden selloff in this emotionally charged commodity market? Or should we expect significantly higher prices in the months ahead? Our first reality check is the monthly gold chart (Figure 1). |

|
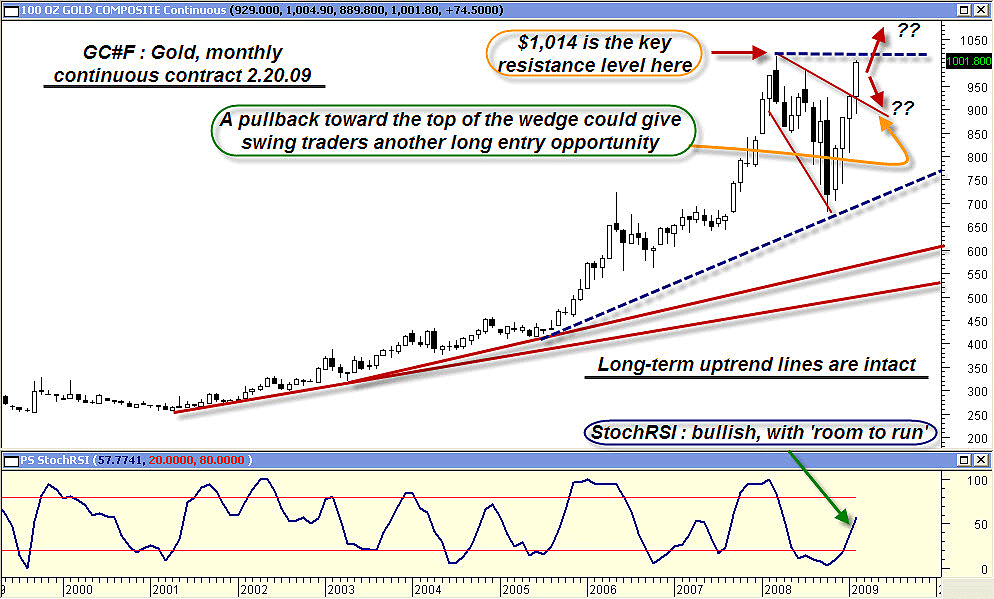
| FIGURE 1: GC, MONTHLY. A major uptrend in progress; the corrective moves grow proportionally larger as the trend moves higher. |
| Graphic provided by: MetaStock. |
| |
| The nine-year-old bull market in gold (literally; it began on February 23, 2001) has had enormous staying power, providing buy & hold investors with an average annual rate of return that's been far beyond that offered by any other asset class. Of course, the longer a bull run continues, the larger the proportional corrections against the major trend usually are. Note how each corrective phase was larger than the one preceding it; of the four significant corrections, the latest one (2008) absolutely dwarfed those that occurred in 2003, 2005, and 2006. Does this mean that this bull run is finished, due to the size of the 2008 correction? Not necessarily. In fact, there are a number of factors that suggest that the March 2008 high of $1,014 may soon be taken out on the way to higher levels. First, all three major uptrend lines are still intact, with prices well above each one. Next, the stochRSI indicator, one of the more reliable momentum-based tools, has made a convincing turn above its signal line. In the gold market, this indicator has done a good job of identifying most of the major cyclical lows since 2001, so its current action is fairly convincing. Of course, nothing is more important than raw price action on the chart, and the strong monthly breakout from the broadening wedge pattern suggests that the March 2008 high at $1,014 should be challenged very quickly. The current monthly candle almost completely fills the area between the March 2008 high and the top channel line of the wedge. Given this constricting technical framework, it will be interesting to see which of these support/resistance lines will prove victorious. We'll drop down to the weekly chart now, digging a little deeper for more specific understanding (Figure 2). |

|
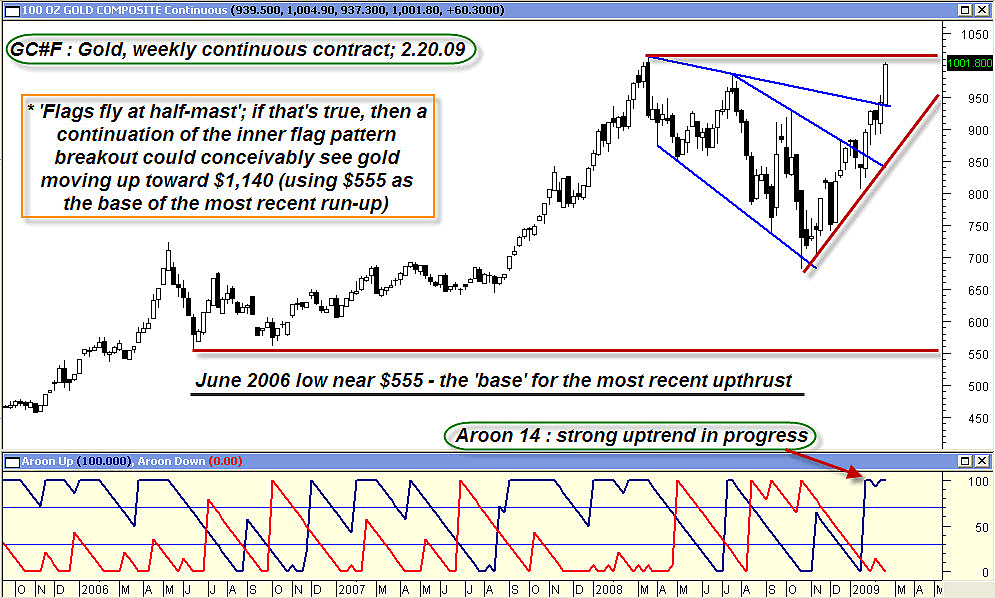
| FIGURE 2: GC, WEEKLY. A breakout from both a weekly flag and wedge pattern is soon to meet with major resistance near $1,014, the March 2008 high. The strong Aroon (14) reading appears supportive of more upside progress. |
| Graphic provided by: MetaStock. |
| |
| Here, we note that not only has price broken out of the monthly wedge, but it also busted above a significant weekly flag pattern, too. If we use the June 2006 low of $555 as the base for the run to the $1,014 high, this weekly flag pattern has a nominal terminus area near $1,140. Given that the weekly Aroon 14 confirms the strong uptrend, if the $1,014 high can be taken out on a weekly close, the projected flag may very well hit $1,140 sometime in the coming weeks. Of course, the area adjacent to $1,014 could be a major battleground, and it's entirely possible that the breakout could fail. A sharp pullback from the $1,1014 resistance line might even open up the opportunity for daily-based swing traders to take a shot at a retracement entry. Regardless of what happens, this is going to be a fascinating market to watch. |
| There is no way I'm going to attempt to predict a price target (up or down) for gold. What I can do is attempt to ascertain where the price of gold isn't likely to go in the next few months. That said, here's a trade idea for those with a little adventure in their margin accounts. Here's the setup, a June 2009 gold $670/$2,400 short strangle: Sell 1 June 2009 gold $2,400 call option for $380 or better Sell 1 June 2008 gold $670 put option for $180 or better ----------------------------------------------------------- Net credit: approximately $560 Note how the futures options are priced — they're definitely biased toward a bullish sentiment among option traders. Even though gold would have to rise by 139% by May 26, 2009, in order for the $2,400 call to go in-the-money, it's priced at more than double the $670 put, which is only33% out-of-the-money. This could also be taken as a contrarian indicator, one that suggests that any overexuberance in any given trend direction is an early warning that a correction or reversal is approaching. Regardless, this short strangle seems to offer a reasonable compromise between risk and reward. The major October 2008 low at $681 is above the short put strike and there is also another significant support level near $805. Both support levels could offer interference, should gold decide to move lower from here. As far as the short call at $2,400 goes, although it's possible that gold could rocket that high in the next three months, it does seem far-fetched that such a far out-of-the-money option (with a very tiny delta value) would pose any near-term threat to a $670/$2,400 short strangle seller. As long as the price doesn't close at or above either short strike at June expiration (May 26, 2009) the entire spread will expire worthless, allowing the seller to walk away with the entire $560 in premiums. If price begins to move quickly toward either strike and the spread doubles in value, conservative traders should buy the spread back at a loss. More aggressive traders could simply buy back the option that has moved too quickly toward the in-the-money zone, letting the other option ride, possibly even rolling into a new spread by selling a further out-of-the-money option than the one bought back at a loss. Check with your broker regarding margin requirements, option bid-ask spreads, and open interest figures before considering a short strangle in gold or any other commodity. |
Donald W. Pendergast is a financial markets consultant who offers specialized services to stock brokers and high net worth individuals who seek a better bottom line for their portfolios.
| Title: | Writer, market consultant |
| Company: | Linear Trading Systems LLC |
| Jacksonville, FL 32217 | |
| Phone # for sales: | 904-239-9564 |
| E-mail address: | lineartradingsys@gmail.com |
Traders' Resource Links | |
| Linear Trading Systems LLC has not added any product or service information to TRADERS' RESOURCE. | |
Click here for more information about our publications!
Comments
Date: 03/03/09Rank: 3Comment:

Request Information From Our Sponsors
- StockCharts.com, Inc.
- Candle Patterns
- Candlestick Charting Explained
- Intermarket Technical Analysis
- John Murphy on Chart Analysis
- John Murphy's Chart Pattern Recognition
- John Murphy's Market Message
- MurphyExplainsMarketAnalysis-Intermarket Analysis
- MurphyExplainsMarketAnalysis-Visual Analysis
- StockCharts.com
- Technical Analysis of the Financial Markets
- The Visual Investor
- VectorVest, Inc.
- Executive Premier Workshop
- One-Day Options Course
- OptionsPro
- Retirement Income Workshop
- Sure-Fire Trading Systems (VectorVest, Inc.)
- Trading as a Business Workshop
- VectorVest 7 EOD
- VectorVest 7 RealTime/IntraDay
- VectorVest AutoTester
- VectorVest Educational Services
- VectorVest OnLine
- VectorVest Options Analyzer
- VectorVest ProGraphics v6.0
- VectorVest ProTrader 7
- VectorVest RealTime Derby Tool
- VectorVest Simulator
- VectorVest Variator
- VectorVest Watchdog
