HOT TOPICS LIST
- MACD
- Fibonacci
- RSI
- Gann
- ADXR
- Stochastics
- Volume
- Triangles
- Futures
- Cycles
- Volatility
- ZIGZAG
- MESA
- Retracement
- Aroon
INDICATORS LIST
LIST OF TOPICS
PRINT THIS ARTICLE
by Chaitali Mohile
ViaSat has broken the long-term symmetrical triangle in a bearish direction.
Position: N/A
Chaitali Mohile
Active trader in the Indian stock markets since 2003 and a full-time writer. Trading is largely based upon technical analysis.
PRINT THIS ARTICLE
SYMMETRICAL TRIANGLE
ViaSat Is Retesting Resistance
02/26/09 12:28:42 PMby Chaitali Mohile
ViaSat has broken the long-term symmetrical triangle in a bearish direction.
Position: N/A
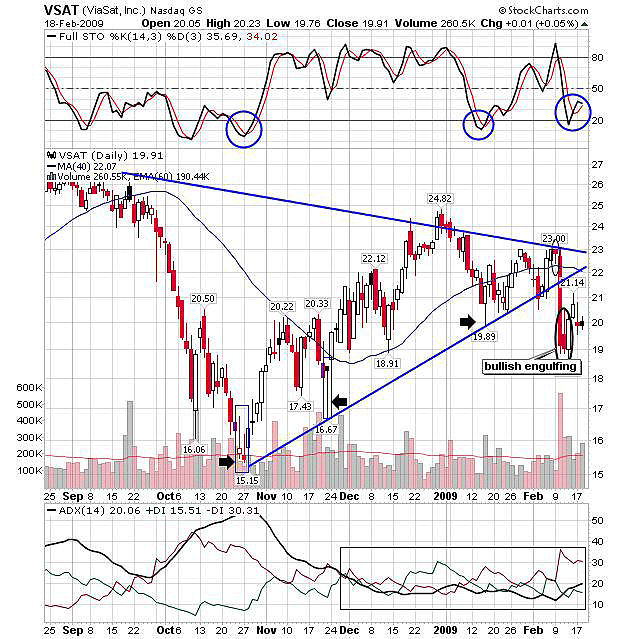
| A long-term symmetrical triangle formed (Figure 1) in the chart of ViaSat (VSAT). As the triangle was being formed, many buying opportunities could be seen from the lower trendline. The marked circles of the full stochastic (14,3,3) and the black arrows on the price chart show those trading levels. Although the symmetrical triangle is a continuation pattern, the trading range of the pattern in Figure 1 is large and can be traded carefully. |

|
| FIGURE 1: VSAT, DAILY. The breakout rally of a symmetrical triangle may rush to challenge the newly formed trendline resistance. |
| Graphic provided by: StockCharts.com. |
| |
| The first buy signal appeared at the new low with an inverted hammer -- a bottom reversal pattern. But as a single candlestick pattern, it requires confirmation for accurate trading. The hammer pattern appears in a downtrend, and the average directional movement index (ADX) (14) in Figure 1 indicated an overheated downtrend. Another indicator that can reconfirm the bottom reversal is an oversold stochastic (14,3,3), which is ready to surge. So triggering a long trade at $15.15 was safe. We can carry such a trade until the stochastic (14,3,3) reaches its overbought area and begins declining. The stochastic (14,3,3) moving flat in an overbought region would indicate consolidation after an ascending rally. |
| In Figure 1, we can see that the stochastic oscillator turned volatile at 80 levels and plunged to the support level at 50. This can be the place to buy VSAT again. The candle with a long lower shadow is hammer -- a bullish reversal candlestick pattern. The pattern indicated that the downtrend is being hammered and the trend is likely to reverse. Following the trading disciplines of the first trade, we can enter long positions, but this time it would be on low volume. |
| The narrow range, the weak ADX (14), and shaky move of the stochastic (14,3,3) in an overbought zone resulted in price volatility. So, initiating a new long trade at $19.89 would have been risky. VSAT formed a hanging man pattern near the upper trendline resistance, indicating a bearish rally. And the symmetrical triangle broke downward. Since the triangle has already broken, we can conclude that the hanging man candle indicated a downside breakout. Otherwise, the symmetrical triangle breakout cannot be anticipated. |
| The breakout of the triangle occurred as the pattern matured. VSAT plunged nearly $5 during the breakout in a single trading session on February 17. The bullish engulfing pattern formed near the previous support at $19, indicating a minor upward rally and retesting the lower trendline resistance. Usually, the price moves back to retest the newly formed resistance/support after the breakout. VSAT is likely to undergo the same process. The lower trendline is the fresh resistance that might get tested. The ADX (14) is indicating the developing downtrend, but the stochastic (14,3,3) has surged above an oversold region. Those traders who are already long can hold the trade till the stochastic oscillator sustains above the 20 level region with the stop-loss at $19 support. |
Active trader in the Indian stock markets since 2003 and a full-time writer. Trading is largely based upon technical analysis.
| Company: | Independent |
| Address: | C1/3 Parth Indraprasth Towers. Vastrapur |
| Ahmedabad, Guj 380015 | |
| E-mail address: | chaitalimohile@yahoo.co.in |
Traders' Resource Links | |
| Independent has not added any product or service information to TRADERS' RESOURCE. | |
Click here for more information about our publications!
Comments

Request Information From Our Sponsors
- VectorVest, Inc.
- Executive Premier Workshop
- One-Day Options Course
- OptionsPro
- Retirement Income Workshop
- Sure-Fire Trading Systems (VectorVest, Inc.)
- Trading as a Business Workshop
- VectorVest 7 EOD
- VectorVest 7 RealTime/IntraDay
- VectorVest AutoTester
- VectorVest Educational Services
- VectorVest OnLine
- VectorVest Options Analyzer
- VectorVest ProGraphics v6.0
- VectorVest ProTrader 7
- VectorVest RealTime Derby Tool
- VectorVest Simulator
- VectorVest Variator
- VectorVest Watchdog
- StockCharts.com, Inc.
- Candle Patterns
- Candlestick Charting Explained
- Intermarket Technical Analysis
- John Murphy on Chart Analysis
- John Murphy's Chart Pattern Recognition
- John Murphy's Market Message
- MurphyExplainsMarketAnalysis-Intermarket Analysis
- MurphyExplainsMarketAnalysis-Visual Analysis
- StockCharts.com
- Technical Analysis of the Financial Markets
- The Visual Investor
