HOT TOPICS LIST
- MACD
- Fibonacci
- RSI
- Gann
- ADXR
- Stochastics
- Volume
- Triangles
- Futures
- Cycles
- Volatility
- ZIGZAG
- MESA
- Retracement
- Aroon
INDICATORS LIST
LIST OF TOPICS
PRINT THIS ARTICLE
by James Kupfer
Gold has been on a tear recently. Where are the primary resistance points?
Position: Sell
James Kupfer
Mr. Kupfer is a market professional and amateur stock market commentator. Disclosure: It is likely that Mr. Kupfer has or will enter a position in any security he writes about.
PRINT THIS ARTICLE
RESISTANCE LINE
Is Gold Losing Its Luster?
02/25/09 10:10:35 AMby James Kupfer
Gold has been on a tear recently. Where are the primary resistance points?
Position: Sell
| The shiny metal has moved higher over the last few months, breaking through some major resistance levels and out of its old channel. Given its recent strength, is gold likely to move higher or hit resistance and turn back down? |
| Is gold likely to move higher? To answer this, let's first establish, cyclically speaking, that gold seemingly has yet to make its nine-year cycle bottom, which means that the move from the November bottom is a countertrend bounce. Assuming that gold has yet to make this bottom, we should be searching for a top to the price of gold rather than looking to go long. |
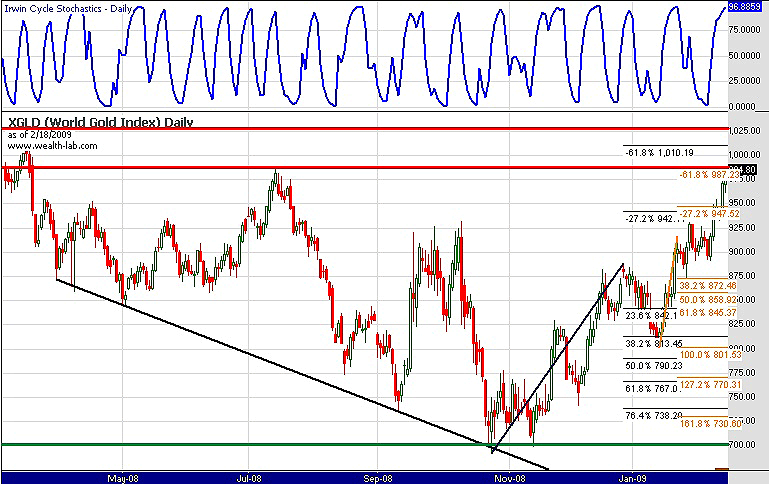
| Looking at Figure 1, it now appears that gold is in a prime spot to potentially halt its upward move. First off, gold is now very close to its July 2008 high of $988.50. In addition, $987.23 is 161.8% -- a Fibonacci ratio of the move between two pivot points in the recent move shown in orange. Last but not least, gold is now significantly overbought on daily, weekly, and monthly time frames, according to Irwin Stochastics. |

|
| FIGURE 1: XGLD, DAILY. Here's a big-picture view of gold. |
| Graphic provided by: Wealth-Lab. |
| |
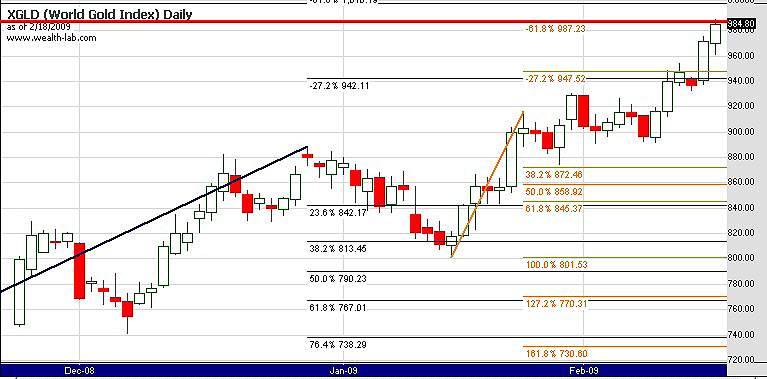
| Should gold make it above the $988 region, there is further resistance at the $1,010 and $1,025 levels, the latter being the March 2008 highs (Figure 2). In the unlikely event that gold were to break above $1,025 to new highs, it would almost certainly invalidate my premise that gold has yet to make its nine-year cycle bottom. In this case, gold would be near the start of a multiyear upward move. |

|
| FIGURE 2: XGLD, DAILY. This closeup view shows gold right at major resistance. |
| Graphic provided by: Wealth-Lab. |
| |
Mr. Kupfer is a market professional and amateur stock market commentator. Disclosure: It is likely that Mr. Kupfer has or will enter a position in any security he writes about.
Click here for more information about our publications!
Comments
Date: 03/03/09Rank: 4Comment:

Request Information From Our Sponsors
- StockCharts.com, Inc.
- Candle Patterns
- Candlestick Charting Explained
- Intermarket Technical Analysis
- John Murphy on Chart Analysis
- John Murphy's Chart Pattern Recognition
- John Murphy's Market Message
- MurphyExplainsMarketAnalysis-Intermarket Analysis
- MurphyExplainsMarketAnalysis-Visual Analysis
- StockCharts.com
- Technical Analysis of the Financial Markets
- The Visual Investor
- VectorVest, Inc.
- Executive Premier Workshop
- One-Day Options Course
- OptionsPro
- Retirement Income Workshop
- Sure-Fire Trading Systems (VectorVest, Inc.)
- Trading as a Business Workshop
- VectorVest 7 EOD
- VectorVest 7 RealTime/IntraDay
- VectorVest AutoTester
- VectorVest Educational Services
- VectorVest OnLine
- VectorVest Options Analyzer
- VectorVest ProGraphics v6.0
- VectorVest ProTrader 7
- VectorVest RealTime Derby Tool
- VectorVest Simulator
- VectorVest Variator
- VectorVest Watchdog
