HOT TOPICS LIST
- MACD
- Fibonacci
- RSI
- Gann
- ADXR
- Stochastics
- Volume
- Triangles
- Futures
- Cycles
- Volatility
- ZIGZAG
- MESA
- Retracement
- Aroon
INDICATORS LIST
LIST OF TOPICS
PRINT THIS ARTICLE
by Donald W. Pendergast, Jr.
Cigna Corp. has one of the highest 13-week relative strength rankings versus the Standard & Poor's 500. Is there an opportunity here for traders or investors?
Position: Accumulate
Donald W. Pendergast, Jr.
Donald W. Pendergast is a financial markets consultant who offers specialized services to stock brokers and high net worth individuals who seek a better bottom line for their portfolios.
PRINT THIS ARTICLE
MOMENTUM
Cigna's High Relative Strength
02/20/09 12:26:13 PMby Donald W. Pendergast, Jr.
Cigna Corp. has one of the highest 13-week relative strength rankings versus the Standard & Poor's 500. Is there an opportunity here for traders or investors?
Position: Accumulate
| Not every segment of the US financial sector was creamed in the credit-crunched bear market wipeout of 2007-08. Although very few stocks (in any sector) emerged without suffering major setbacks in the price of their stock prices, some companies continued to earn profits and carry on in a relatively normal fashion. Cigna, the giant health insurer, appears to have been one of those fortunate companies. Its stock is up by more than 150% since the November lows and it keeps chugging higher, despite all of the increasingly negative economic news splattered all over the news media. What exactly is the technical state of this huge S&P 500 component stock? |

|
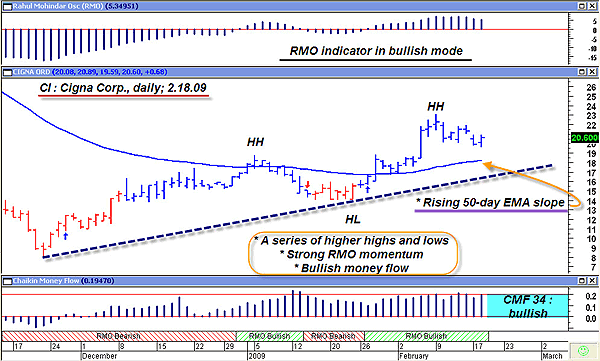
| FIGURE 1: CI, DAILY. High relative strength vs. the S&P 500, a solid uptrend and bullish momentum/money flow readings all combine to suggest more good times ahead for Cigna shares. |
| Graphic provided by: MetaStock. |
| Graphic provided by: Rahul Mohindar oscillator (RMO) from MetaStock. |
| |
| Altogether, the technical image on the daily chart is positive (Figure 1). Price has finally managed to form a higher low that is well above its upsloping 50-day exponential moving average (EMA); in addition, a series of higher highs and lows has already printed. In the top pane of the chart is the Rahul Mohindar oscillator (RMO), a unique momentum indicator that helps keep a trader on the right side of the dominant trend. Buying pullbacks toward a significant support level (like a Fibonacci 38.2% or 61.8% retracement) when the RMO is on the positive side of its zero line is one useful way to utilize this indicator. Odds of success also seem to be enhanced by taking bullish trade setups that are on the north side of the 50-day EMA, particularly when the Chaikin money flow (CMF) (34) is also on the positive side of its zero line. Such a setup may have just printed; price has pulled back approximately 38% of the last upswing's length, even as the RMO and CMF (34) are supportive of a long move. |
| Today's (February 18, 2009) bullish reversal bar could be used as the basis for a short-term swing trade; a buy-stop could be placed at $20.91 and, if filled, an initial stop placed just below Wednesday's low near $19.57. The initial target is the prior swing high of $23.06, yielding a nominal risk to reward ratio of approximately 1.6 to 1. Since this stock has such great 13-week relative strength shrewd traders might attempt to take half profits if the $23.06 level were reached, letting the rest ride with a trailing stop. "Momentum precedes price," the old trader's saying goes, and this is one stock in which the benefit of the doubt should likely be biased in favor of higher prices. |
Donald W. Pendergast is a financial markets consultant who offers specialized services to stock brokers and high net worth individuals who seek a better bottom line for their portfolios.
| Title: | Writer, market consultant |
| Company: | Linear Trading Systems LLC |
| Jacksonville, FL 32217 | |
| Phone # for sales: | 904-239-9564 |
| E-mail address: | lineartradingsys@gmail.com |
Traders' Resource Links | |
| Linear Trading Systems LLC has not added any product or service information to TRADERS' RESOURCE. | |
Click here for more information about our publications!
PRINT THIS ARTICLE

Request Information From Our Sponsors
- VectorVest, Inc.
- Executive Premier Workshop
- One-Day Options Course
- OptionsPro
- Retirement Income Workshop
- Sure-Fire Trading Systems (VectorVest, Inc.)
- Trading as a Business Workshop
- VectorVest 7 EOD
- VectorVest 7 RealTime/IntraDay
- VectorVest AutoTester
- VectorVest Educational Services
- VectorVest OnLine
- VectorVest Options Analyzer
- VectorVest ProGraphics v6.0
- VectorVest ProTrader 7
- VectorVest RealTime Derby Tool
- VectorVest Simulator
- VectorVest Variator
- VectorVest Watchdog
- StockCharts.com, Inc.
- Candle Patterns
- Candlestick Charting Explained
- Intermarket Technical Analysis
- John Murphy on Chart Analysis
- John Murphy's Chart Pattern Recognition
- John Murphy's Market Message
- MurphyExplainsMarketAnalysis-Intermarket Analysis
- MurphyExplainsMarketAnalysis-Visual Analysis
- StockCharts.com
- Technical Analysis of the Financial Markets
- The Visual Investor
