HOT TOPICS LIST
- MACD
- Fibonacci
- RSI
- Gann
- ADXR
- Stochastics
- Volume
- Triangles
- Futures
- Cycles
- Volatility
- ZIGZAG
- MESA
- Retracement
- Aroon
INDICATORS LIST
LIST OF TOPICS
PRINT THIS ARTICLE
by James Kupfer
Where in support should the Dow Jones 30 break the November 2008 lows?
Position: Sell
James Kupfer
Mr. Kupfer is a market professional and amateur stock market commentator. Disclosure: It is likely that Mr. Kupfer has or will enter a position in any security he writes about.
PRINT THIS ARTICLE
FIBONACCI
New Lows Approaching?
02/20/09 08:47:25 AMby James Kupfer
Where in support should the Dow Jones 30 break the November 2008 lows?
Position: Sell
| On February 17, 2009, the Dow Jones Industrial Average (DJIA) dropped almost 300 points to close at 7552. This close brings the DJIA within points of breaking the November 2008 lows. With any follow-through to the downside, the DJIA would trade at its lowest levels since 2002 when it reached a low of 7197. |
| Before breaking below 7200, the bears will have to break through significant support. As noted, it is the bottom of the 2000–02 bear market. Further, 7119 is the 50% Fibonacci retracement level from the lows of the Great Depression to the November 2007 market peak. |
| Since we are in the strong grip of a major bear market, I think it is almost inevitable that we will reach and, in the not-too-distant future, break below the 7200 level. Should that forecast come to fruition, where is the next major support level? We can use Fibonacci analysis to develop guidelines for where the market may be headed. |

|
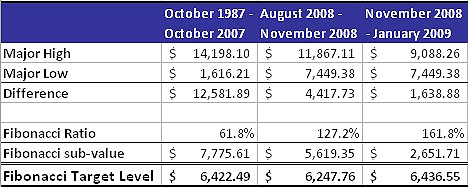
| FIGURE 1: FIBONACCI TARGET LEVELS. Here are clustered Fibonacci support levels. |
| Graphic provided by: Excel. |
| |
| On Figure 1, you can see the major highs and lows of significant time periods for the DJIA — for example, the market bottom of 1987 and the market top in 2007. In this case, 61.8% of the difference between these market extremes leads to a price target of 6422. For the three examples noted, the average is 6369. This is not a hard and fast number, but if and when the DJIA approaches this level, it would be prudent to look to cover short positions and consider establishing long ones. |
Mr. Kupfer is a market professional and amateur stock market commentator. Disclosure: It is likely that Mr. Kupfer has or will enter a position in any security he writes about.
Click here for more information about our publications!
Comments
Date: 02/23/09Rank: 3Comment:

Request Information From Our Sponsors
- VectorVest, Inc.
- Executive Premier Workshop
- One-Day Options Course
- OptionsPro
- Retirement Income Workshop
- Sure-Fire Trading Systems (VectorVest, Inc.)
- Trading as a Business Workshop
- VectorVest 7 EOD
- VectorVest 7 RealTime/IntraDay
- VectorVest AutoTester
- VectorVest Educational Services
- VectorVest OnLine
- VectorVest Options Analyzer
- VectorVest ProGraphics v6.0
- VectorVest ProTrader 7
- VectorVest RealTime Derby Tool
- VectorVest Simulator
- VectorVest Variator
- VectorVest Watchdog
- StockCharts.com, Inc.
- Candle Patterns
- Candlestick Charting Explained
- Intermarket Technical Analysis
- John Murphy on Chart Analysis
- John Murphy's Chart Pattern Recognition
- John Murphy's Market Message
- MurphyExplainsMarketAnalysis-Intermarket Analysis
- MurphyExplainsMarketAnalysis-Visual Analysis
- StockCharts.com
- Technical Analysis of the Financial Markets
- The Visual Investor
