HOT TOPICS LIST
- MACD
- Fibonacci
- RSI
- Gann
- ADXR
- Stochastics
- Volume
- Triangles
- Futures
- Cycles
- Volatility
- ZIGZAG
- MESA
- Retracement
- Aroon
INDICATORS LIST
LIST OF TOPICS
PRINT THIS ARTICLE
by Donald W. Pendergast, Jr.
Can it be? Is the developing triple-bottom pattern on the crude oil daily chart for real? If so, how far might crude prices rise?
Position: Accumulate
Donald W. Pendergast, Jr.
Donald W. Pendergast is a financial markets consultant who offers specialized services to stock brokers and high net worth individuals who seek a better bottom line for their portfolios.
PRINT THIS ARTICLE
CHART ANALYSIS
Crude Oil Triple Bottom Close To Completion?
02/20/09 12:11:48 PMby Donald W. Pendergast, Jr.
Can it be? Is the developing triple-bottom pattern on the crude oil daily chart for real? If so, how far might crude prices rise?
Position: Accumulate
| The action over the past few months in the crude oil market has been generally unpredictable, yet when looked at from a long-term perspective, it's been exactly the kind of "back and fill" price action that might be expected at a major cyclical bottom. How much more consolidation needs to take place before price begins to move strongly in either direction? |

|
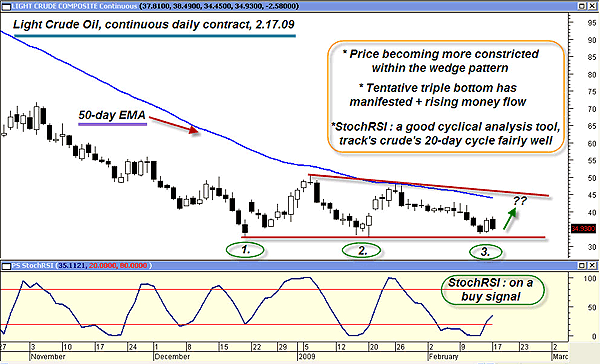
| FIGURE 1: CL, DAILY. A triple bottom, coiling price action within a wedge pattern, and a stochRSI buy signal appear to bode well for some sort of a crude oil swing move. |
| Graphic provided by: MetaStock. |
| |
| The daily graph of the continuous crude oil contract (Figure 1) depicts the slow, steady period of consolidation that commenced in mid-December 2008. A triple bottom is close to being confirmed, and if a new upswing develops, there could be quite a bit of renewed interest in this vital commodity market. Anytime you have three tests of a support level, particularly when a stock or commodity is extremely oversold on a monthly basis, many traders will be watching, preparing to initiate new long positions (all else being equal) on the successful test of the pattern. Price is becoming more constricted within the wedge pattern even as the stochRSI indicator has flashed a fresh buy signal. The risk-reward on this signal isn't all that great; a buy-stop order could be placed at $38.50 with an initial stop just below the recent low near $33.52. The first swing target would be near $44, which is the 50-day exponential moving average (EMA) price. The upper channel line of the wedge is near $45 so, all told, the RR ratio comes in at about 1.30 to 1. Given the tremendous leverage involved in futures contracts, that's a fairly poor RR ratio. More adventurous types might try to wait for a possible pullback toward the lower support level, using a 30- or 60-minute chart to time an entry. Traders with a longer-term bullish outlook, those who feel that the triple-bottom pattern is going to hold on a possible retest, might want to take the lazy man's way out. Instead of trying to time an exact entry into a long crude oil position, they could just sell an out-of-the-money put option. Right now (Tuesday, February 17, 2009), a trader could collect $180 in cash for selling a May $25 crude oil put option. May 2009 crude closed at $40.98 today, meaning that crude prices would have to drop 39% by April 16, 2009, before the option would close in-the-money. If the May contract closes at $25 or below, the trader would be assigned a long crude oil contract with a basis of $25. Given the steady global demand for crude oil, that's an assignment risk that some traders might be more than willing to accept. |

|
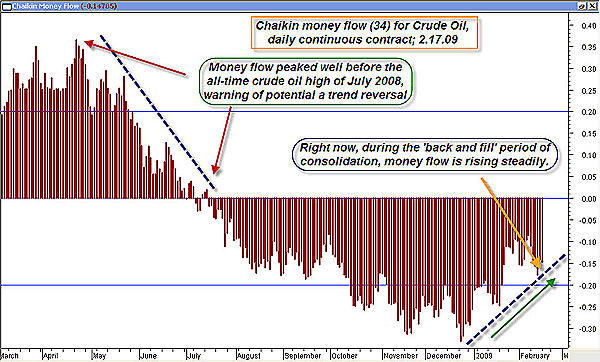
| FIGURE 2: CMF, DAILY. The CMF (34) indicator is very useful at spotting meaningful divergences in stocks and commodities. Crude oil is apparently being accumulated during the past two months of consolidating price action. |
| Graphic provided by: MetaStock. |
| |
| Figure 2 is the Chaikin money flow (CMF) (34) for the daily crude (continuous) contract. It's very effective at spotting divergences between money flow and price action. The CMF (34) peaked nearly three months (in April 2008) before crude oil hit its all-time price in July 2008. We all know what happened after that divergence played out. Right now, a different kind of CMF (34) divergence is printing, the kind that shows progressive amounts of accumulation during sideways or consolidating price action. This money flow evidence, coming at a time of a daily triple bottom and a major monthly cycle low, should be enough to rekindle the flame of hope in energy market bulls everywhere. Whether you choose to sell a put or time a swing trade, the probabilities seem to favor some sort of a bullish move by crude oil in the weeks ahead. |
Donald W. Pendergast is a financial markets consultant who offers specialized services to stock brokers and high net worth individuals who seek a better bottom line for their portfolios.
| Title: | Writer, market consultant |
| Company: | Linear Trading Systems LLC |
| Jacksonville, FL 32217 | |
| Phone # for sales: | 904-239-9564 |
| E-mail address: | lineartradingsys@gmail.com |
Traders' Resource Links | |
| Linear Trading Systems LLC has not added any product or service information to TRADERS' RESOURCE. | |
Click here for more information about our publications!
Comments
Date: 02/23/09Rank: 2Comment:

Request Information From Our Sponsors
- StockCharts.com, Inc.
- Candle Patterns
- Candlestick Charting Explained
- Intermarket Technical Analysis
- John Murphy on Chart Analysis
- John Murphy's Chart Pattern Recognition
- John Murphy's Market Message
- MurphyExplainsMarketAnalysis-Intermarket Analysis
- MurphyExplainsMarketAnalysis-Visual Analysis
- StockCharts.com
- Technical Analysis of the Financial Markets
- The Visual Investor
- VectorVest, Inc.
- Executive Premier Workshop
- One-Day Options Course
- OptionsPro
- Retirement Income Workshop
- Sure-Fire Trading Systems (VectorVest, Inc.)
- Trading as a Business Workshop
- VectorVest 7 EOD
- VectorVest 7 RealTime/IntraDay
- VectorVest AutoTester
- VectorVest Educational Services
- VectorVest OnLine
- VectorVest Options Analyzer
- VectorVest ProGraphics v6.0
- VectorVest ProTrader 7
- VectorVest RealTime Derby Tool
- VectorVest Simulator
- VectorVest Variator
- VectorVest Watchdog
