HOT TOPICS LIST
- MACD
- Fibonacci
- RSI
- Gann
- ADXR
- Stochastics
- Volume
- Triangles
- Futures
- Cycles
- Volatility
- ZIGZAG
- MESA
- Retracement
- Aroon
INDICATORS LIST
LIST OF TOPICS
PRINT THIS ARTICLE
by Chaitali Mohile
Buffalo Wild Wings has violated the upper Bollinger band with the huge gap-up breakout. The Bollinger band is one of the reliable technical tools that can be used to identify the trading directions and the volatility.
Position: N/A
Chaitali Mohile
Active trader in the Indian stock markets since 2003 and a full-time writer. Trading is largely based upon technical analysis.
PRINT THIS ARTICLE
BOLLINGER BANDS
BWLD Has Surged
02/19/09 03:33:49 PMby Chaitali Mohile
Buffalo Wild Wings has violated the upper Bollinger band with the huge gap-up breakout. The Bollinger band is one of the reliable technical tools that can be used to identify the trading directions and the volatility.
Position: N/A
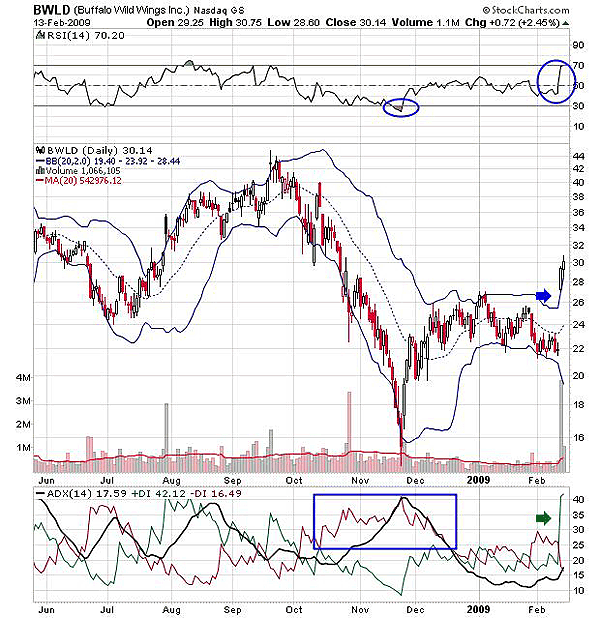
| The Bollinger band tool signals the extreme levels of the market like an oversold/overbought conditions and the volatility as well. The market is considered oversold when the price touches the lower Bollinger band and overbought when the price reaches an upper band. The convergence or divergence of both the bands resembles the volatility prevailing in the stock/ index. When the bands converge (move closer) the volatility is low and vice versa. The utility of this tool varies from trader to trader. Some trade within an upper and the lower band, while some buy above the upper band and sell below the lower one. We will try to understand some of the characteristic of the Bollinger band tool with the help of Figure 1. |
| Buffalo Wild Wings (BWLD) was overbought in September 2008. The price hugged the upper band several times before moving south. The upper band restricted the price from rallying higher. The relative strength index (RSI) (14) and the average directional movement index (ADX) (14) is used to reconfirm the overextended levels on either side. It is always advisable to use more than one technical indicator for systematic trading decisions. In Figure 1 we can see that the RSI (14) was equally overbought when the price was flirting around the upper band. In fact, the oscillator showed a negative divergence to the price movement. Similarly, the uptrend was overheated in August and began declining in September when the price was at its peak. So the Bollinger band correctly indicated the overbought conditions and the possibility of price correction. |

|
| FIGURE 1: BWLD, DAILY. The stock has moved above the upper Bollinger band. |
| Graphic provided by: StockCharts.com. |
| |
| BWLD declined with the support of the lower band until the support was finally broken in November, indicating an oversold rally. The price plunged to the lowest point below $16 and the RSI (14) slipped below an oversold level of 30. The ADX (14) showed an overheated downtrend. Thus, the oversold signal by the Bollinger band was reconfirmed. With these bullish reversal indications, BWLD surged toward an upper band. Though the overheated downtrend declined, it failed to develop the fresh buying pressure during the new bullish rally. As a result, the stock consolidated under the resistance of an upper band and the RSI (14) moved with the bullish support of 50 levels, indicating bullish strength in consolidation. |
| Recently, BWLD has broken out with a huge gap up and violated the upper Bollinger band resistance. This is a new buying opportunity for those traders who grab the long trade above an upper band and short below the lower band. The RSI (14) has rushed into an overbought zone, indicating bullish strength. The ADX (14) is indicating increased buying pressure after the price moved above the upper Bollinger band. Thus, such breakouts can be bought. BWLD can be bought at the current levels with the stop-loss at $27. But I would suggest that traders stay on the sidelines till the ADX (14) develops the uptrend for the low-risk trade. In addition, the volatility across the global financial markets is very high. So following a tight stop-loss is essential and our technical indicator would help filter our trade. In such market conditions, traders should be keen on booking small profits. |
Active trader in the Indian stock markets since 2003 and a full-time writer. Trading is largely based upon technical analysis.
| Company: | Independent |
| Address: | C1/3 Parth Indraprasth Towers. Vastrapur |
| Ahmedabad, Guj 380015 | |
| E-mail address: | chaitalimohile@yahoo.co.in |
Traders' Resource Links | |
| Independent has not added any product or service information to TRADERS' RESOURCE. | |
Click here for more information about our publications!
Comments
Date: 02/20/09Rank: 5Comment:

Request Information From Our Sponsors
- StockCharts.com, Inc.
- Candle Patterns
- Candlestick Charting Explained
- Intermarket Technical Analysis
- John Murphy on Chart Analysis
- John Murphy's Chart Pattern Recognition
- John Murphy's Market Message
- MurphyExplainsMarketAnalysis-Intermarket Analysis
- MurphyExplainsMarketAnalysis-Visual Analysis
- StockCharts.com
- Technical Analysis of the Financial Markets
- The Visual Investor
- VectorVest, Inc.
- Executive Premier Workshop
- One-Day Options Course
- OptionsPro
- Retirement Income Workshop
- Sure-Fire Trading Systems (VectorVest, Inc.)
- Trading as a Business Workshop
- VectorVest 7 EOD
- VectorVest 7 RealTime/IntraDay
- VectorVest AutoTester
- VectorVest Educational Services
- VectorVest OnLine
- VectorVest Options Analyzer
- VectorVest ProGraphics v6.0
- VectorVest ProTrader 7
- VectorVest RealTime Derby Tool
- VectorVest Simulator
- VectorVest Variator
- VectorVest Watchdog
