HOT TOPICS LIST
- MACD
- Fibonacci
- RSI
- Gann
- ADXR
- Stochastics
- Volume
- Triangles
- Futures
- Cycles
- Volatility
- ZIGZAG
- MESA
- Retracement
- Aroon
INDICATORS LIST
LIST OF TOPICS
PRINT THIS ARTICLE
by Paolo Pezzutti
Trading a breakout of the long consolidation is an option.
Position: N/A
Paolo Pezzutti
Author of the book "Trading the US Markets - A Comprehensive Guide to US Markets for International Traders and Investors" - Harriman House (July 2008)
PRINT THIS ARTICLE
TECHNICAL ANALYSIS
Utilities Moving Sideways
02/18/09 09:27:03 AMby Paolo Pezzutti
Trading a breakout of the long consolidation is an option.
Position: N/A
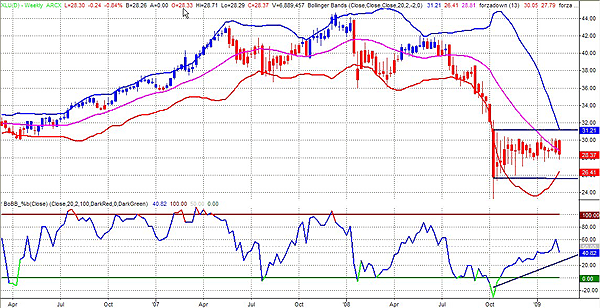
| In June 2008, when I wrote an article about utilities, the price of the Utilities Select Sector SPDR (XLU) was about $40. Prices were in a trading range and after the breakout to the downside, they moved to print a new low at $23.28 in October. Since then, XLU has started a long consolidation. If you see the weekly chart in Figure 1, it looks as if a congestion with prices contained within the wide-ranging bar printed during the first week of October. Basically after the panic selling, XLU has managed to build a base and move slightly higher to the present value of $28. If this is the premise for another leg to the downside, it is difficult to say. In this time frame, the force index indicator, which I used to indicate the trend, is still negative. This indicator takes into account price and volume. A 13-bar exponential moving average (EMA) of the force index is used to track longer-term changes in the force of the market's participants. In the figure you can also see the %b indicator, which is derived from the Bollinger bands. It measures where the last price is in relation to the bands. The %b moved up from the oversold level; its value is about 40 and it does not provide useful indications. Prices are in the middle between the bands, which are converging quickly as a result of the ongoing sideways phase. |

|
| FIGURE 1: XLU, WEEKLY. Prices are developing a long congestion. The Bollinger bands are still converging in this time frame. |
| Graphic provided by: TradeStation. |
| |
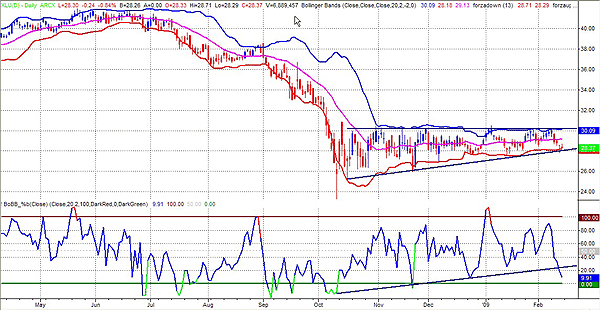
| Moving to the daily time frame (Figure 2), the formation is more evident and it displays the interesting feature of having higher lows. The resistance at $30 has been tested many times and its breakout to the upside would be a very reliable signal. To the upside, XLU would have a potential to reach the area at $32–33. Prices are now testing the rising trendline. The force index indicator is negative also in this time frame. The %b indicator after printing a negative divergence in coincidence with the last test of the resistance at $30 has managed to break out its trendline to the downside. It is difficult to say if the indicator is anticipating a price move. The Bollinger bands are parallel and narrow; the price is close to the lower band, which has acted as a support in the past. |

|
| FIGURE 2: XLU, DAILY. Higher lows of the long formation indicate that prices could break out to the upside. You can see that the $30 level has been tested many times and a breakout would be a reliable signal. |
| Graphic provided by: TradeStation. |
| |
| It is hard to predict on which side the breakout will occur. The higher lows in the formation indicate that chances are that we will see an exit to the upside. But I would not bet on it. There are different options on how to open a trade; one is trading the breakout on either side, while the other is trying to anticipate the exit based on a pattern or risk-reward considerations. |
Author of the book "Trading the US Markets - A Comprehensive Guide to US Markets for International Traders and Investors" - Harriman House (July 2008)
| Address: | VIA ROBERTO AGO 26 POSTAL CODE 00166 |
| Rome, ITALY | |
| Phone # for sales: | +393357540708 |
| E-mail address: | pezzutti.paolo@tiscali.it |
Click here for more information about our publications!
Comments
Date: 02/18/09Rank: 5Comment:

Request Information From Our Sponsors
- StockCharts.com, Inc.
- Candle Patterns
- Candlestick Charting Explained
- Intermarket Technical Analysis
- John Murphy on Chart Analysis
- John Murphy's Chart Pattern Recognition
- John Murphy's Market Message
- MurphyExplainsMarketAnalysis-Intermarket Analysis
- MurphyExplainsMarketAnalysis-Visual Analysis
- StockCharts.com
- Technical Analysis of the Financial Markets
- The Visual Investor
- VectorVest, Inc.
- Executive Premier Workshop
- One-Day Options Course
- OptionsPro
- Retirement Income Workshop
- Sure-Fire Trading Systems (VectorVest, Inc.)
- Trading as a Business Workshop
- VectorVest 7 EOD
- VectorVest 7 RealTime/IntraDay
- VectorVest AutoTester
- VectorVest Educational Services
- VectorVest OnLine
- VectorVest Options Analyzer
- VectorVest ProGraphics v6.0
- VectorVest ProTrader 7
- VectorVest RealTime Derby Tool
- VectorVest Simulator
- VectorVest Variator
- VectorVest Watchdog
