HOT TOPICS LIST
- MACD
- Fibonacci
- RSI
- Gann
- ADXR
- Stochastics
- Volume
- Triangles
- Futures
- Cycles
- Volatility
- ZIGZAG
- MESA
- Retracement
- Aroon
INDICATORS LIST
LIST OF TOPICS
PRINT THIS ARTICLE
by Alan R. Northam
The S&P 500 is currently in a wave 2 market correction. Once this correction is completed, the S&P 500 will thrust downward to a new price low.
Position: N/A
Alan R. Northam
Alan Northam lives in the Dallas, Texas area and as an electronic engineer gave him an analytical mind from which he has developed a thorough knowledge of stock market technical analysis. His abilities to analyze the future direction of the stock market has allowed him to successfully trade of his own portfolio over the last 30 years. Mr. Northam is now retired and trading the stock market full time. You can reach him at inquiry@tradersclassroom.com or by visiting his website at http://www.tradersclassroom.com. You can also follow him on Twitter @TradersClassrm.
PRINT THIS ARTICLE
ELLIOTT WAVE
S&P 500 To Thrust Lower
02/18/09 09:05:46 AMby Alan R. Northam
The S&P 500 is currently in a wave 2 market correction. Once this correction is completed, the S&P 500 will thrust downward to a new price low.
Position: N/A
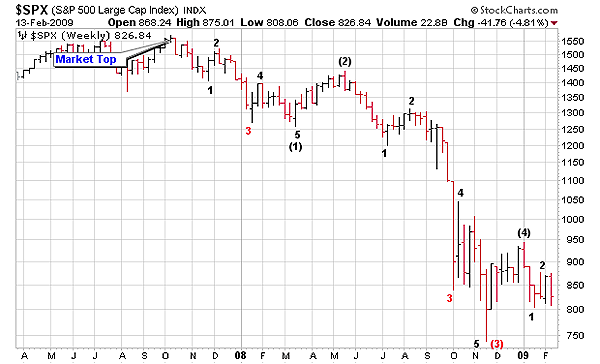
| According to the Elliott wave theory, wave 3s are the ones that move the farthest in price and usually does so in the shortest period of time. Thus, wave 3s are the thrust wave. The Standard & Poor's 500 is now ready to start wave 3 downward, which should draw this index below its November 2008 low. Following the completion of wave 3, the index will undergo a small upward corrective rally, followed by a final move down to yet lower lows. |
| Figure 1 shows the weekly bar chart of the S&P 500. Note that in this chart there are three wave 3s. Further, note that wave (1) is made up of a sequence of waves labeled waves 1, 2, 3, 4, and 5. Of these five, wave 3 is the one that fell the furthest distance in price. Wave (3) is also made up of five waves. Of those five, wave 3 also fell the furthest in price. In addition, wave (3) itself fell further in price difference between it and wave (1). These examples then show that wave 3s are the ones that move the most when compared to the other waves in its wave sequence. |

|
| FIGURE 1: S&P 500, WEEKLY. Weekly bar chart of the S&P 500 showing the Elliott waves from the market top in October 2007 to the present. |
| Graphic provided by: StockCharts.com. |
| |
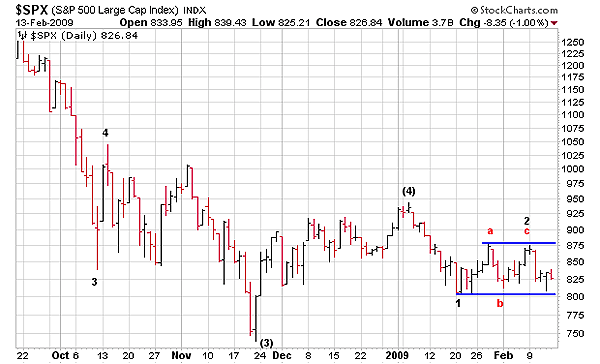
| Looking closer at the price chart of the S&P 500, Figure 2 shows the daily price bars of this index. The daily chart shows that corrective wave (4) is complete and wave (5) down is under way. Wave (5) will also be made up of five waves — 1, 2, 3, 4, and 5. Of these waves, wave 1 is complete and wave 2 may also be complete unless it extends. Wave 2 is a corrective wave which, when complete, if it is not already, will ultimately draw price below the low of wave 1 (see blue horizontal line). A move below this blue line will be a signal that wave 2 is finally complete and wave 3 down is under way. |

|
| FIGURE 2: S&P 500, DAILY. This chart also shows that wave 1 of wave (5) is complete and wave 2 may be complete as well. A move below the lower horizontal blue line drawn off the low of wave 1 will confirm that wave 2 is complete and that wave 3 or (5) is under way. |
| Graphic provided by: StockCharts.com. |
| |
| The S&P 500 is currently in the process of completing corrective wave 2, if it hasn't already done so. Once wave 2 is complete, wave 3 will thrust the S&P 500 downward quickly to a lower price than that formed in November 2008. Upon completion of wave 3, the S&P 500 will undergo a small upward price correction to be followed by a more gentle final wave 5 downward that will then lead to an even lower price that will then complete wave (5) downward. |
Alan Northam lives in the Dallas, Texas area and as an electronic engineer gave him an analytical mind from which he has developed a thorough knowledge of stock market technical analysis. His abilities to analyze the future direction of the stock market has allowed him to successfully trade of his own portfolio over the last 30 years. Mr. Northam is now retired and trading the stock market full time. You can reach him at inquiry@tradersclassroom.com or by visiting his website at http://www.tradersclassroom.com. You can also follow him on Twitter @TradersClassrm.
| Garland, Tx | |
| Website: | www.tradersclassroom.com |
| E-mail address: | inquiry@tradersclassroom.com |
Click here for more information about our publications!
Comments
Date: 02/18/09Rank: 5Comment:
Date: 02/19/09Rank: 5Comment:

Request Information From Our Sponsors
- StockCharts.com, Inc.
- Candle Patterns
- Candlestick Charting Explained
- Intermarket Technical Analysis
- John Murphy on Chart Analysis
- John Murphy's Chart Pattern Recognition
- John Murphy's Market Message
- MurphyExplainsMarketAnalysis-Intermarket Analysis
- MurphyExplainsMarketAnalysis-Visual Analysis
- StockCharts.com
- Technical Analysis of the Financial Markets
- The Visual Investor
- VectorVest, Inc.
- Executive Premier Workshop
- One-Day Options Course
- OptionsPro
- Retirement Income Workshop
- Sure-Fire Trading Systems (VectorVest, Inc.)
- Trading as a Business Workshop
- VectorVest 7 EOD
- VectorVest 7 RealTime/IntraDay
- VectorVest AutoTester
- VectorVest Educational Services
- VectorVest OnLine
- VectorVest Options Analyzer
- VectorVest ProGraphics v6.0
- VectorVest ProTrader 7
- VectorVest RealTime Derby Tool
- VectorVest Simulator
- VectorVest Variator
- VectorVest Watchdog
