HOT TOPICS LIST
- MACD
- Fibonacci
- RSI
- Gann
- ADXR
- Stochastics
- Volume
- Triangles
- Futures
- Cycles
- Volatility
- ZIGZAG
- MESA
- Retracement
- Aroon
INDICATORS LIST
LIST OF TOPICS
PRINT THIS ARTICLE
by Donald W. Pendergast, Jr.
Some market analysts feel that the top of the bond market is already in. But after having declined so rapidly, is there another opportunity to short TLT, the long-term bond exchange traded fund?
Position: Sell
Donald W. Pendergast, Jr.
Donald W. Pendergast is a financial markets consultant who offers specialized services to stock brokers and high net worth individuals who seek a better bottom line for their portfolios.
PRINT THIS ARTICLE
SUPPORT & RESISTANCE
TLT Short Sale Alert
02/17/09 09:48:25 AMby Donald W. Pendergast, Jr.
Some market analysts feel that the top of the bond market is already in. But after having declined so rapidly, is there another opportunity to short TLT, the long-term bond exchange traded fund?
Position: Sell
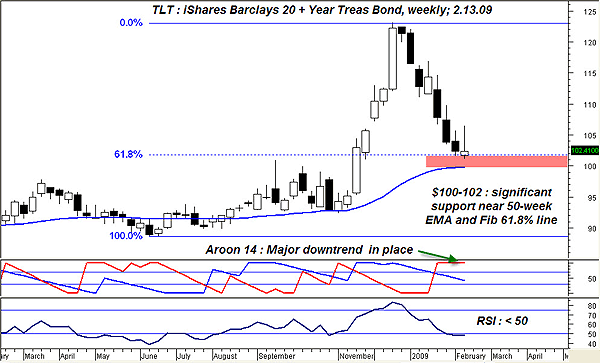
| TLT, the iShares 20 + Year Treasury Bond exchange traded fund (ETF), has dropped precipitously since making a major high in December 2008. Apparently, a lot of worried cash found its way into the "safe haven" called the government bond market as the credit crunch grew more menacing, but after enduring this recent 17% plunge, the long government bond and its related ETF, TLT, may not look as attractive to nervous investors as it did six months ago. Reviewing TLT's weekly graph (Figure 1) reveals that a strong downtrend is in place, as evidenced by the extremely bearish posture of the Aroon (14) indicator and a weekly realtive strength index (RSI) (14) reading that has finally dipped below the all-important 50 level. The weekly cycle (not shown) is also hard down. Moderating this bearishness to some extent is the combined support level defined by the Fibonacci 61.8% retracement and the 50-week exponential moving average (EMA). Spanning a zone from about $99.50 to $102, there should be some slowdown in the rate of decline (if not an outright corrective move higher) if the lower end of this support zone is challenged. Given the speed and severity of this move, however, the downtrend should be presumed to be intact at least until a higher weekly low can be accomplished on a corrective move higher. No one knows how this will all play out, but it is good to at least know that TLT is within $2 to $3 of a major weekly support zone. |

|
| FIGURE 1: TLT, WEEKLY. While the Aroon 14 and RSI 14 indicators suggest a major downtrend for TLT, major support barriers lie just below the current price. |
| Graphic provided by: MetaStock. |
| |
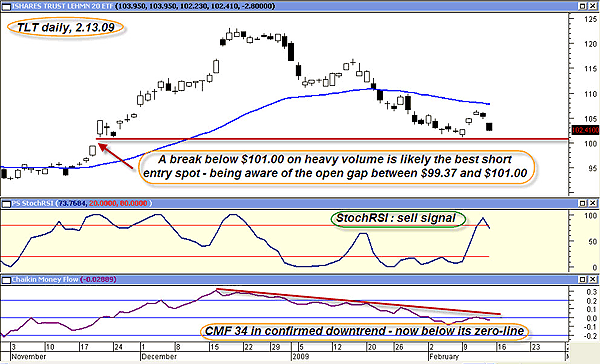
| TLT's daily chart (Figure 2) does show a possible short setup — the stochRSI has rolled over just shy of the downsloping 50-day EMA, price has gapped lower on fairly wide range and the Chaikin money flow (34), already in a heavy downtrend, has just dipped below its zero line. Of course, the series of lower highs and lower lows also confirms the current bearish tendencies of TLT. While aggressive traders might want to go short on a break below Friday's low ($102.23), the strong support level at $101 means that this setup has a poor risk to reward ratio, if using the recent swing high ($106.50) as an initial stop price. It might be more prudent to see how TLT handles the $101 support level, not to mention the still-open gap that covers the area from $99.37 to $101. |

|
| FIGURE 2: TLT, DAILY. Numerous indicators suggest a short-sale opportunity, but the risk-reward ratio is less than ideal here. Dropping to a lower time frame and attempting a short on a drop below $101 might prove more feasible for nimble traders. |
| Graphic provided by: MetaStock. |
| |
| How to play TLT on a possible breakdown of the $101 support? Well, aggressive traders could use a 10- or 15-minute chart and try to catch a potential breakdown just south of $101, attempting to close out the trade near the other side of the gap at $99.37, which will probably be another heavy support area. |
| Sometimes, the best policy is to just stand aside, even when a daily and weekly trend agree on a direction. The existence of major support/resistance barriers must always be given due consideration before attempting to structure any swing trade in any time frame. In this case, the numerous technical barriers between $99.37 and $102 were enough to negate a potential short sale on the daily time frame. Are there any support/resistance barriers standing in the way of your next anticipated swing trade? |
Donald W. Pendergast is a financial markets consultant who offers specialized services to stock brokers and high net worth individuals who seek a better bottom line for their portfolios.
| Title: | Writer, market consultant |
| Company: | Linear Trading Systems LLC |
| Jacksonville, FL 32217 | |
| Phone # for sales: | 904-239-9564 |
| E-mail address: | lineartradingsys@gmail.com |
Traders' Resource Links | |
| Linear Trading Systems LLC has not added any product or service information to TRADERS' RESOURCE. | |
Click here for more information about our publications!
Comments
Date: 02/18/09Rank: 5Comment:

Request Information From Our Sponsors
- StockCharts.com, Inc.
- Candle Patterns
- Candlestick Charting Explained
- Intermarket Technical Analysis
- John Murphy on Chart Analysis
- John Murphy's Chart Pattern Recognition
- John Murphy's Market Message
- MurphyExplainsMarketAnalysis-Intermarket Analysis
- MurphyExplainsMarketAnalysis-Visual Analysis
- StockCharts.com
- Technical Analysis of the Financial Markets
- The Visual Investor
- VectorVest, Inc.
- Executive Premier Workshop
- One-Day Options Course
- OptionsPro
- Retirement Income Workshop
- Sure-Fire Trading Systems (VectorVest, Inc.)
- Trading as a Business Workshop
- VectorVest 7 EOD
- VectorVest 7 RealTime/IntraDay
- VectorVest AutoTester
- VectorVest Educational Services
- VectorVest OnLine
- VectorVest Options Analyzer
- VectorVest ProGraphics v6.0
- VectorVest ProTrader 7
- VectorVest RealTime Derby Tool
- VectorVest Simulator
- VectorVest Variator
- VectorVest Watchdog
