HOT TOPICS LIST
- MACD
- Fibonacci
- RSI
- Gann
- ADXR
- Stochastics
- Volume
- Triangles
- Futures
- Cycles
- Volatility
- ZIGZAG
- MESA
- Retracement
- Aroon
INDICATORS LIST
LIST OF TOPICS
PRINT THIS ARTICLE
by Donald W. Pendergast, Jr.
After a four-month period of sideways to down price action, rising money flows in the midst of a triple-bottom pattern have resulted in a convincing bullish breakout for Coca-Cola, the king of colas.
Position: Accumulate
Donald W. Pendergast, Jr.
Donald W. Pendergast is a financial markets consultant who offers specialized services to stock brokers and high net worth individuals who seek a better bottom line for their portfolios.
PRINT THIS ARTICLE
ACCUM./DIST. CHAIKIN
KO Accumulation, Triple Bottom, And Breakout
02/17/09 09:03:19 AMby Donald W. Pendergast, Jr.
After a four-month period of sideways to down price action, rising money flows in the midst of a triple-bottom pattern have resulted in a convincing bullish breakout for Coca-Cola, the king of colas.
Position: Accumulate
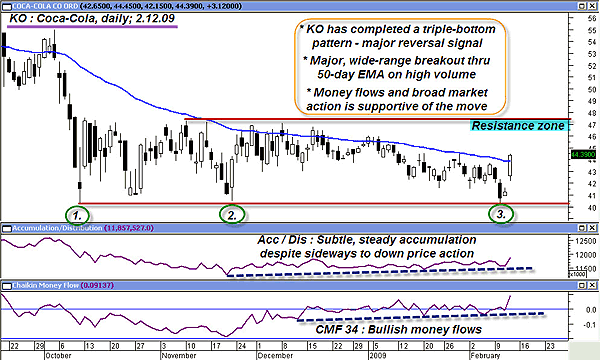
| Coca-Cola (KO), one of the better-known names in the Dow Jones Industrial Average (DJIA), has fared as well as the DJIA did during the epic 2008–09 bear market. One interesting difference, however, is the fact that Coke didn't break to new lows in November 2008. Since making the first of three major lows in October 2008, the stock has traced out a large sideways to down consolidation pattern, remaining stuck in a sloppy $40–47 range. However, as the range-bound action trudged on, day after day, the smart money was apparently taking the opportunity to get a piece of the real thing (that is, shares of Coca-Cola), as evidenced by the accumulation/distribution and Chaikin money flow (34) indicators. Note how both money flow indicators (which attempt to measure the amount of buying and selling pressure in any given stock) began to manifest slightly bullish trends starting in late November 2008, remaining bullish despite a mild downtrend in the stock over the past two months. No doubt, many institutional trading desks had their eyes glued to this developing accumulation pattern, one that frequently gives advance warning of an impending (and sometimes major) shift in trend and/or investor sentiment. |

|
| FIGURE 1: KO, DAILY. Bullish money flows and a triple-bottom pattern, followed by a high-volume, wide-range breakout, can sometimes be precursors to major moves. |
| Graphic provided by: MetaStock. |
| |
| On Thursday, February 12, the DJIA was down for most of the day before staging a late afternoon reversal, printing a long lower-shadow candlestick. Will this reversal initiate the long-awaited rally that will confirm the double-bottom scenario envisioned by some technicians? Or will this simply fade away tomorrow, dismissed as meaningless in the wake of more trillion-dollar bailouts and rising unemployment rates? No one really knows, but it's normally the case that the broad market indexes will put in a lasting major low about six to 12 months before the economy begins to exhibit signs of a turnaround. Could Coca-Cola be one of the bellwether stocks helping to revive a very beaten-down market? Only time will tell. Meanwhile, here's an idea on how to play the breakout in Coca-Cola. |
| Given the very solid-looking floor beneath this stock at $40, here's an option credit spread that might be worth a shot if Coke pulls back a bit (and thus inflating put option premiums). Here's the setup, remembering only to initiate it on a pullback and only if the $40 support line holds: Sell 1 March 2009 $40 put Buy 1 March 2009 $35 put --------------------------- Net credit: $0.60 or better Note: this will require at least a $2–2.50 pullback in KO from Thursday's close of $44.39 in order to get this kind of credit for the spread. The idea with this kind of spread is for KO shares to close above $40 at March expiration. Daily time decay really begins to accelerate with 30 days or less until expiration, speeding up during the final two weeks before expiration. As a result, the spread will wither away to zero value — guaranteed — as long as KO remains above $40 until expiration. If the trade moves opposite to plan, simply close out the spread if it gets close to doubling in value. |
| Shorter-term traders might want to wait for a pullback on a 30-minute chart and attempt to play Coke's new-found strength that way. Breakouts can be fickle, subject to numerous fakeouts, but if the underlying structure of the higher time frame is bullish, as in this case, trading the intraday moves can be a profitable enterprise. |
Donald W. Pendergast is a financial markets consultant who offers specialized services to stock brokers and high net worth individuals who seek a better bottom line for their portfolios.
| Title: | Writer, market consultant |
| Company: | Linear Trading Systems LLC |
| Jacksonville, FL 32217 | |
| Phone # for sales: | 904-239-9564 |
| E-mail address: | lineartradingsys@gmail.com |
Traders' Resource Links | |
| Linear Trading Systems LLC has not added any product or service information to TRADERS' RESOURCE. | |
Click here for more information about our publications!
Comments
Date: 02/18/09Rank: 3Comment:

Request Information From Our Sponsors
- StockCharts.com, Inc.
- Candle Patterns
- Candlestick Charting Explained
- Intermarket Technical Analysis
- John Murphy on Chart Analysis
- John Murphy's Chart Pattern Recognition
- John Murphy's Market Message
- MurphyExplainsMarketAnalysis-Intermarket Analysis
- MurphyExplainsMarketAnalysis-Visual Analysis
- StockCharts.com
- Technical Analysis of the Financial Markets
- The Visual Investor
- VectorVest, Inc.
- Executive Premier Workshop
- One-Day Options Course
- OptionsPro
- Retirement Income Workshop
- Sure-Fire Trading Systems (VectorVest, Inc.)
- Trading as a Business Workshop
- VectorVest 7 EOD
- VectorVest 7 RealTime/IntraDay
- VectorVest AutoTester
- VectorVest Educational Services
- VectorVest OnLine
- VectorVest Options Analyzer
- VectorVest ProGraphics v6.0
- VectorVest ProTrader 7
- VectorVest RealTime Derby Tool
- VectorVest Simulator
- VectorVest Variator
- VectorVest Watchdog
