HOT TOPICS LIST
- MACD
- Fibonacci
- RSI
- Gann
- ADXR
- Stochastics
- Volume
- Triangles
- Futures
- Cycles
- Volatility
- ZIGZAG
- MESA
- Retracement
- Aroon
INDICATORS LIST
LIST OF TOPICS
PRINT THIS ARTICLE
by Mike Carr, CMT
Government reports can move markets, but should they?
Position: N/A
Mike Carr, CMT
Mike Carr, CMT, is a member of the Market Technicians Association, and editor of the MTA's newsletter, Technically Speaking. He is also the author of "Smarter Investing in Any Economy: The Definitive Guide to Relative Strength Investing," and "Conquering the Divide: How to Use Economic Indicators to Catch Stock Market Trends."
PRINT THIS ARTICLE
STRATEGIES
Can You Really Trade Economic News?
02/13/09 08:41:57 AMby Mike Carr, CMT
Government reports can move markets, but should they?
Position: N/A
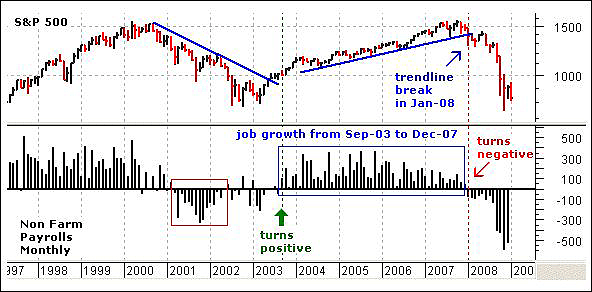
| Figure 1 is a near-perfect stock market timing model. The logic is clear — when jobs are being created, the Standard & Poor's 500 moves higher. When job growth is negative, stocks decline. This is a relationship you'd expect to see since job growth is necessary in a healthy economy and stock price growth over the long-term is in line with GDP growth. |

|
| FIGURE 1: S&P 500. Perfect market timing with the US unemployment report. |
| Graphic provided by: TDTrader.com. |
| |
| We could fine-tune this model with moving averages and catch tops and bottoms in the stock market within a month in almost all cases. With sound underlying logic, there should be no reason the model would ever fail. |
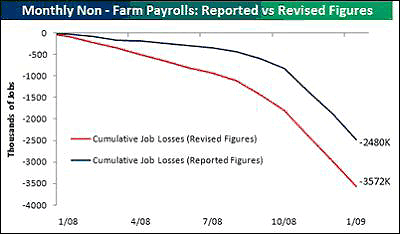
| The problem is shown in Figure 2. The official data is often changed repeatedly after it is first reported, meaning the historical test results shown in Figure 1 could not be achieved in real-time. As shown, the US economy has lost 3.6 million jobs since the start of 2008 with most of those losses, nearly 80%, coming during the last five months. While the sheer number of job losses is huge, each month it has been getting worse than it was the previous months. The unemployment report from January showed that employers cut 598,000 jobs during January. This number is likely to be revised in next month's report. |

|
| FIGURE 2: NONFARM PAYROLLS, MONTHLY. Revisions are constant and substantial. |
| Graphic provided by: Bespoke Research. |
| |
| Economic statistics are almost always revised after their initial report. In Figure 2, Bespoke tracks the magnitude of these revisions in the unemployment report. The upper line is the reported figures on the day of the initial release as well as the most recently revisions. They wrote, "As shown, based on reported numbers, the US economy would have lost 2.48 million jobs since the start of 2008. However, once we take into account the negative revisions, the US economy has lost another 1.1 million jobs, representing a 44% increase in jobs lost." |
| Given the frequent and often drastic revisions to economic data, investors cannot rely on government reports for market forecasting. The best approach is to combine multiple data series to develop an indicator for the most likely direction of the economy and the market. This is the approach employed by the Conference Board's Leading Economic Indicator, one of the most reliable forecasting sources. |
Mike Carr, CMT, is a member of the Market Technicians Association, and editor of the MTA's newsletter, Technically Speaking. He is also the author of "Smarter Investing in Any Economy: The Definitive Guide to Relative Strength Investing," and "Conquering the Divide: How to Use Economic Indicators to Catch Stock Market Trends."
| Website: | www.moneynews.com/blogs/MichaelCarr/id-73 |
| E-mail address: | marketstrategist@gmail.com |
Click here for more information about our publications!
PRINT THIS ARTICLE

Request Information From Our Sponsors
- StockCharts.com, Inc.
- Candle Patterns
- Candlestick Charting Explained
- Intermarket Technical Analysis
- John Murphy on Chart Analysis
- John Murphy's Chart Pattern Recognition
- John Murphy's Market Message
- MurphyExplainsMarketAnalysis-Intermarket Analysis
- MurphyExplainsMarketAnalysis-Visual Analysis
- StockCharts.com
- Technical Analysis of the Financial Markets
- The Visual Investor
- VectorVest, Inc.
- Executive Premier Workshop
- One-Day Options Course
- OptionsPro
- Retirement Income Workshop
- Sure-Fire Trading Systems (VectorVest, Inc.)
- Trading as a Business Workshop
- VectorVest 7 EOD
- VectorVest 7 RealTime/IntraDay
- VectorVest AutoTester
- VectorVest Educational Services
- VectorVest OnLine
- VectorVest Options Analyzer
- VectorVest ProGraphics v6.0
- VectorVest ProTrader 7
- VectorVest RealTime Derby Tool
- VectorVest Simulator
- VectorVest Variator
- VectorVest Watchdog
