HOT TOPICS LIST
- MACD
- Fibonacci
- RSI
- Gann
- ADXR
- Stochastics
- Volume
- Triangles
- Futures
- Cycles
- Volatility
- ZIGZAG
- MESA
- Retracement
- Aroon
INDICATORS LIST
LIST OF TOPICS
PRINT THIS ARTICLE
by James Kupfer
What is going on in the CRB?
Position: Hold
James Kupfer
Mr. Kupfer is a market professional and amateur stock market commentator. Disclosure: It is likely that Mr. Kupfer has or will enter a position in any security he writes about.
PRINT THIS ARTICLE
TREND-CHANNEL
CRB Doldrums
02/13/09 08:36:37 AMby James Kupfer
What is going on in the CRB?
Position: Hold
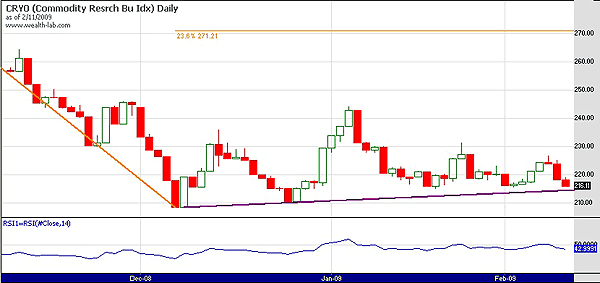
| At the beginning of January 2009, I suggested to readers that the Commodity Research Bureau Index (CRB) might well have hit an intermediate-term bottom. Since then, the CRB has traded in a relatively tight range, neither rebounding after its tremendous fall nor increasing in value to any appreciable extent. |

|
| FIGURE 1: CRB, DAILY. The CRB index lacks any clear direction other than sideways. |
| Graphic provided by: Wealth-lab. |
| |
| As can be seen in Figure 1, both price and the relative strength index (RSI) are very flat. On the bearish side, the RSI has been unable to break above 50, thus indicating a continued level of weakness in the CRB. On the bull's side is the fact that the CRB has continued to remain above the slightly upward-sloping purple trendline. |
| Now, however, we are at an important juncture. For the CRB to have any chance to rebound, it must successfully test the support line. Failure to hold the line would likely lead to a retest of the December 2008 lows. Failure to hold that low would likely mean a resumption of the previous downward trend and a continuing series of fresh new lows. |
Mr. Kupfer is a market professional and amateur stock market commentator. Disclosure: It is likely that Mr. Kupfer has or will enter a position in any security he writes about.
Click here for more information about our publications!
Comments
Date: 02/15/09Rank: 2Comment:
Date: 02/17/09Rank: 5Comment:

Request Information From Our Sponsors
- StockCharts.com, Inc.
- Candle Patterns
- Candlestick Charting Explained
- Intermarket Technical Analysis
- John Murphy on Chart Analysis
- John Murphy's Chart Pattern Recognition
- John Murphy's Market Message
- MurphyExplainsMarketAnalysis-Intermarket Analysis
- MurphyExplainsMarketAnalysis-Visual Analysis
- StockCharts.com
- Technical Analysis of the Financial Markets
- The Visual Investor
- VectorVest, Inc.
- Executive Premier Workshop
- One-Day Options Course
- OptionsPro
- Retirement Income Workshop
- Sure-Fire Trading Systems (VectorVest, Inc.)
- Trading as a Business Workshop
- VectorVest 7 EOD
- VectorVest 7 RealTime/IntraDay
- VectorVest AutoTester
- VectorVest Educational Services
- VectorVest OnLine
- VectorVest Options Analyzer
- VectorVest ProGraphics v6.0
- VectorVest ProTrader 7
- VectorVest RealTime Derby Tool
- VectorVest Simulator
- VectorVest Variator
- VectorVest Watchdog
