HOT TOPICS LIST
- MACD
- Fibonacci
- RSI
- Gann
- ADXR
- Stochastics
- Volume
- Triangles
- Futures
- Cycles
- Volatility
- ZIGZAG
- MESA
- Retracement
- Aroon
INDICATORS LIST
LIST OF TOPICS
PRINT THIS ARTICLE
by James Kupfer
Are there any clues about which way the Dow Jones 30 is headed?
Position: Hold
James Kupfer
Mr. Kupfer is a market professional and amateur stock market commentator. Disclosure: It is likely that Mr. Kupfer has or will enter a position in any security he writes about.
PRINT THIS ARTICLE
RSI
Dow's Direction?
02/13/09 08:32:38 AMby James Kupfer
Are there any clues about which way the Dow Jones 30 is headed?
Position: Hold
| As the weakest of the three major equity markets, the Dow Jones 30 may be a good indicator for the rest of the equity markets. Let's look at some simple indicators to see what they may be telling us about the DJ 30's near-term future. |

|
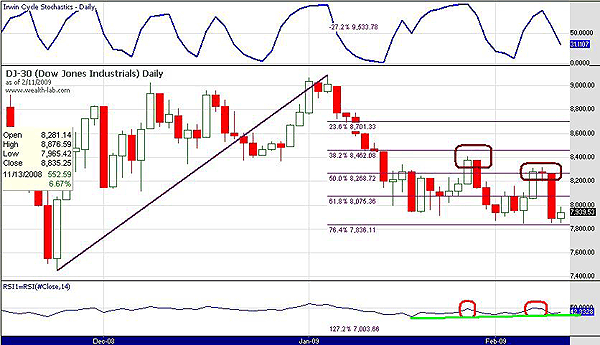
| FIGURE 1: DJIA, DAILY. The RSI shows weakness as well as potential strength. Stochastics are neutral. |
| Graphic provided by: Wealth-lab. |
| |
| In the neutral category is the fact that the DJ 30 has remained in a relatively tight trading range for about the last month. It has not found the leadership to move significantly either up or down. After such a dramatic move downward in 2008, this might be construed as a possible long-term positive in that the market may be consolidating before a move back up. While I do not feel this is actually the case, it is worth taking a look at this as a possible scenario. |
| On the near-term bull side is that the DJ 30 has managed to hold the 76.4% Fibonacci retracement line indicated in purple. Each time the Dow Jones Industrial Average successfully tests this support zone, the stronger it becomes. In addition, the relative strength index (RSI) is displaying a potential divergence between price and the indicator. The RSI is making a series of slightly higher lows, while conversely, price is making a series of slightly lower lows. This demonstrates a potential underlying strength in the market. |
| On the bear side we have two items worthy of note. First, the RSI has been unable to break above 50 since the beginning of January. This is indicative of an underlying weakness in the market. Second, the DJ 30 has made a series of lower highs along with slightly lower lows. |
| All in all, there is no clear near-term direction present or developing. The evidence for both bulls and bears largely cancels one another out. At this juncture the most prudent alternative may be to wait for the market to present a clearer picture or trade with a downside bias as the market is still in the bear's grip and the long- and intermediate-term direction still appear to be down. |
Mr. Kupfer is a market professional and amateur stock market commentator. Disclosure: It is likely that Mr. Kupfer has or will enter a position in any security he writes about.
Click here for more information about our publications!
Comments
Date: 02/17/09Rank: 4Comment: I agree
Date: 02/17/09Rank: 5Comment:

|

Request Information From Our Sponsors
- StockCharts.com, Inc.
- Candle Patterns
- Candlestick Charting Explained
- Intermarket Technical Analysis
- John Murphy on Chart Analysis
- John Murphy's Chart Pattern Recognition
- John Murphy's Market Message
- MurphyExplainsMarketAnalysis-Intermarket Analysis
- MurphyExplainsMarketAnalysis-Visual Analysis
- StockCharts.com
- Technical Analysis of the Financial Markets
- The Visual Investor
- VectorVest, Inc.
- Executive Premier Workshop
- One-Day Options Course
- OptionsPro
- Retirement Income Workshop
- Sure-Fire Trading Systems (VectorVest, Inc.)
- Trading as a Business Workshop
- VectorVest 7 EOD
- VectorVest 7 RealTime/IntraDay
- VectorVest AutoTester
- VectorVest Educational Services
- VectorVest OnLine
- VectorVest Options Analyzer
- VectorVest ProGraphics v6.0
- VectorVest ProTrader 7
- VectorVest RealTime Derby Tool
- VectorVest Simulator
- VectorVest Variator
- VectorVest Watchdog
